Discovery Global Value Equity Feeder Fund
The "contrarian value" investment approach of the Discovery Global Value Equity Feeder Fund has met with considerable success since its launch on 21 February 2013.
Over its nearly five-year track record, the fund has been a top-quartile performer as it taps into a UK domestic theme that has helped drive returns.
The strategy is to identify stocks that are out of favour in the market but have sound fundamentals that predict future growth. The strong performance by US banks in the last year bode well for investors in the Discovery Global Value Equity Feeder Fund, who saw returns of 31.86% over the year to 30 September 2017 and 17.1% annualised over three years to end September 2017.
| Top 10 collective investment schemes over one year to 30 September 2017 | |
| Fund | Return |
| Discovery Global Value Equity Feeder (A) | 31.86% |
| Sygnia Itrix Eurostoxx50 ETF | 28.05% |
| Denker SCI Global Financial Feeder (A1) | 27.79% |
| Coronation Global Emerging Markets Flexible (ZAR) (A) | 25.52% |
| Denker SCI Emerging Markets Feeder (A1) | 22.91% |
| BlueAlpha BCI Global Equity (A) | 22.63% |
| Element Balanced SCI Fund (A) | 22.25% |
| Lion of Africa MET Equity (A) | 21.57% |
| Metope MET Property (A) | 20.41% |
| Coronation Resources (P) | 20.06% |
| Top 10 collective investment schemes over one year to 30 September 2017 | |
| Fund | Return |
| Absa Property Equity (A) | 23.52% |
| Discovery Global Value Equity Feeder (A) | 31.86% |
| Prescient China Balanced Feeder (A1) | 22.84% |
| Long Beach Flexible Prescient (A1) | 17.82% |
| Discovery Global Value Equity Feeder (A) | 17.10% |
| Plexus Wealth BCI Property (A) | 16.71% |
| Sygnia Itrix MSCI US ETF | 16.67% |
| BlueAlpha BCI Global Equity (A) | 16.39% |
| Old Mutual Global Equity (A) | 15.81% |
| AF Investments Global Equity Feeder (A) | 15.64% |
| Sesfikile BCI Property (A1) | 15.59% |
Source: Profile Data, Personal Finance newspaper, 19 November 2017
Macroeconomic fears around Brexit have unveiled a number of cheap UK domestic stocks. In the fourth quarter of 2017 a new position was established in oil services company Tenaris. We also added to a number of our UK domestic holdings, including Virgin Money, home improvement retailer, Travis Perkins and supplier of heavy building materials, Forterra.
This has reflected positively in our performance entering Q4 2017 as can be seen in the graph below.
Active rolling three-year returns to end October 2017
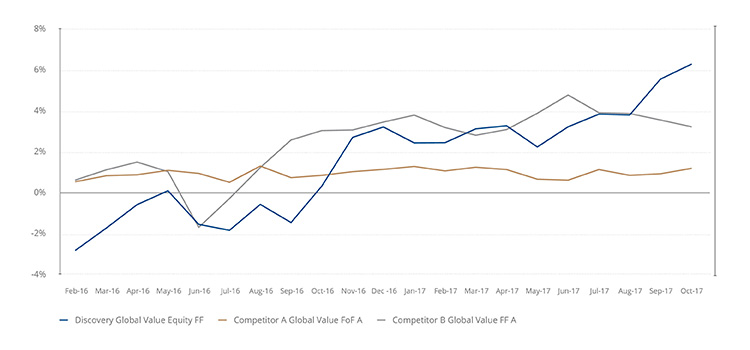
Source: Investec Asset Management
2017 Summary
The fund performed well in 2017 against a backdrop of further underperformance by value stocks, with the fund outperforming not only this 'value factor' but the broader global equity market, too. Japanese stocks, in particular, were strong contributors to the fund's outperformance, due to a combination of positive local equity market returns, healthy underlying business performance and re-ratings of our specific Japanese holdings. While some of our Japanese positions remain attractively valued, we will not hold onto a stock solely due to its newfound popularity, and have recently reduced or sold a number of our Japanese holdings accordingly.
2018 Outlook
With equity markets moving ever-higher, often despite a lack of underlying earnings growth, we continue to be disciplined in not overpaying for businesses, and will only look for investment opportunities where we see genuine value. Currently those pockets of value reside in sectors such as financials and energy (both of which have resulted in recent additions to the portfolio) and in regions such as emerging markets and the UK. The UK is currently one of the cheapest of all developed markets in our investable universe, with what we believe are some very attractive investment opportunities spanning financial, industrial and consumer discretionary sectors, explaining the fund's overweight allocation to that market.
Disclaimer
This article should not be taken as financial advice and is meant for information purposes only. For all advice related matters please contact your financial adviser. The views contained herein are not those of Discovery Limited or any of its subsidiaries and are those of the author/s.
What the investment is
This Fund is a Collective Investment Scheme (also known as a unit trust fund) regulated by the Collective Investment Schemes Control Act, 45 of 2002 (CISCA). Collective investment schemes in securities are generally medium- to long-term investments (around three to five years).
Who manages the investment
Discovery Life Collective Investments (Pty) Ltd, branded as Discovery Invest, is the manager of the Fund. Discovery Invest is a member of the Association of Savings and Investment South Africa (ASISA).
You decide about the suitability of this investment for your needs
By investing in this Fund, you confirm that:
- We did not provide you with any financial and investment advice about this investment
- You have taken particular care to consider whether this investment is suitable for your own needs, personal investment objectives and financial situation.
You understand that your investment may go up or down
- The value of units (known as participatory interests) may go down as well as up.
- Past performance is not necessarily an indication of future performance.
- Exchange rates may fluctuate, causing the value of investments with international exposure to go up or down.
- The capital value and investment returns of your portfolio may go up or down. We do not provide any guarantees about the capital or the returns of a portfolio.
How we calculate the unit prices and value the portfolios
- We calculate unit trust prices on a net-asset value basis. (The net asset value is defined as the total market value of all assets in the unit portfolio, including any income accrued and less any allowable deductions from the portfolio, divided by the number of units in issue.)
- The securities in collective investment schemes are traded at ruling prices using forward pricing. (Forward pricing means pricing all buy and sell orders of units according to the next net-asset value).
- We value all portfolios every business day at 16:00, except on the last business day of the month when we value the portfolios at 17:00.
- For the money market portfolio, the price of each unit is aimed at a constant value. This means that all returns are provided in the form of a distribution and that a change in the capital value will be an exception and only due to abnormal losses.
- Buy and sell orders will receive the same price for that day if we receive them before 11:00 for the money market portfolio and before 14:00for the other portfolios.
- We publish fund prices every business day, with a three-day lag, on www.discovery.co.za
About managing the portfolio
- The portfolio manager may borrow up to 10% of the portfolio's market value from any appropriate financial institution in order to bridge insufficient liquidity.
- The securities in collective investment schemes are traded at ruling prices using forward pricing. (Forward pricing means pricing all buy and sell orders of units according to the next net-asset value).
- The portfolio manager can borrow and lend scrip.
- The portfolio may be closed in order to be managed according to the mandate (if applicable).
Fees and charges for this investment
There are fees and other charges for this investment.
The fees and charges that apply to this investment are included in the net asset value of the units and you do not have to pay any extra amounts. These fees and charges may include:
- The initial fund management fee
- Commission
- Incentives (if applicable)
- Brokerage fees
- Market securities tax
- Auditor fees
- Bank charges
- Trustee fees
- Custodian fees
You can ask us for a schedule of fees, charges and maximum commissions.
The total expense ratio
- Total expense ratio means a measure of a portfolio's assets that have been expended as payment for services rendered in the management of the portfolio or collective investment scheme, expressed as a percentage of the average daily value of the portfolio or collective investment scheme calculated over a period of a financial year by the manager of the portfolio or collective investment scheme.
- A percentage of the net asset value of the portfolio is for fees and other charges relating to managing the portfolio. The percentage is referred to as the total expense ratio (TER).
- A higher TER does not necessarily imply poor return, nor does a low TER imply good return.
- The current TER is not an indication of any future TERs. If fees go up, the TER is also expected to increase.
- During any phase-in period, the TERs do not include information gathered over a full year.
Transaction cost
- Investors and advisers can use transaction cost (TC) as a measure to work out the costs they will incur in buying and selling the underlying assets of a portfolio.
- The transaction cost is expressed as a percentage of the daily net asset value of the portfolio calculated over three years on an annualised basis. (This means the amount of interest an investment earns each year on average over three years, expressed as a percentage.)
- Transaction cost is a necessary costs in administering the Fund. It affects the Fund's returns. It should not be considered in isolation as returns may also be affected by many other factors over time, including:
- Market returns
- The type of fund
- The investment decisions of the investment manager
- The TER.
- Where a fund is less than one year old, the TER and transaction cost cannot be calculated accurately. This is because:
- The life span of the fund is short
- Calculations are based on actual data where possible and best estimates where actual data is not available.
- The TER and the TC shown on the fund sheet are the latest available figures.