Three things history teaches us about investing
The views expressed in this article are those of Steve Watson and not of Discovery Invest.

Media headlines screaming of a recession may have raised concerns for investors. South Africa's economy shrunk by 0.7% in the second quarter of 2018, after a contraction of 2.6% in the first quarter of the year. This placed the country in a technical recession in September.
For the last three to five years, investors have been disappointed by returns from local equity markets. Between the start of the year and the end of August 2018, the JSE All Share Index gained 0.3%. Over the same period, the All Bond Index returned 4.5%, SA Cash gained 4.8% and listed property fell by a whopping 20.1%1.
However, globally we're actually experiencing the longest US bull market in history. In the New York Times, Paul Krugman, put it best when he said, "We're living in an era of political turmoil and economic calm. Can it last?" To answer that question, Steve Watson, Investment Marketing Director for Africa at Investec Asset Management, outlines some of the investment lessons from history that should remind investors to remain focused on their long-term strategy.
History lesson one: Bull markets and economic expansion don't die of old age
An excellent example of this is Australia, which has grown for 108 quarters in a row - that's a total of 27 years (as at May 2018). Bull markets and economic expansion die of shock. Markets don't like surprises, and so it is more important to be prepared for what might go wrong or right, than to monitor the length of the bull market and exiting or entering based on this metric.
So, what could go wrong? The extent of change could be the shock that takes us into a bear market. Examples of global events or changes that could cause a market shock include the trade wars between the US and China, rising populism in Europe and Brexit.
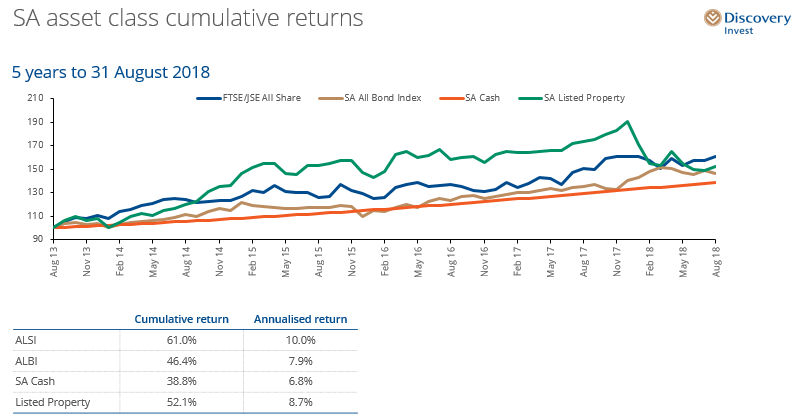
Locally, it's been less rosy. If you look at the graph below, the five-year annualised returns to 31 August 2018 have been reasonable across the five major asset classes in South Africa, but disappointing relative to history. From the riskiest asset class, the All Share Index at the top with 10%, down to listed property at the bottom with 8.47%, returns have been muted in absolute terms. However, all asset classes outperformed inflation, and cumulative returns have been pleasing.

Source: Bloomberg, to 31 August 2018
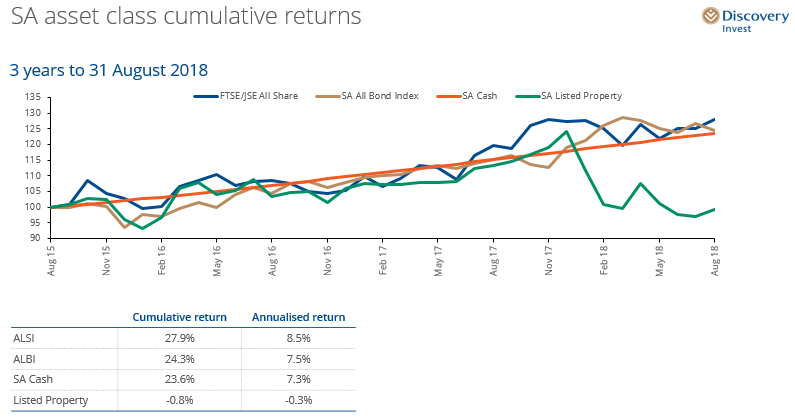
Still, investors have been disappointed by equity returns over the past three years to the end of August 2018 (see graph below).

Source: Bloomberg, to 31 August 2018
Watson says the questions people always ask at this point are, "Should I change? Has something changed? Is it different this time?" This is where history lesson number two comes in.
History lesson two: Equity returns do not arrive in a nice smooth line
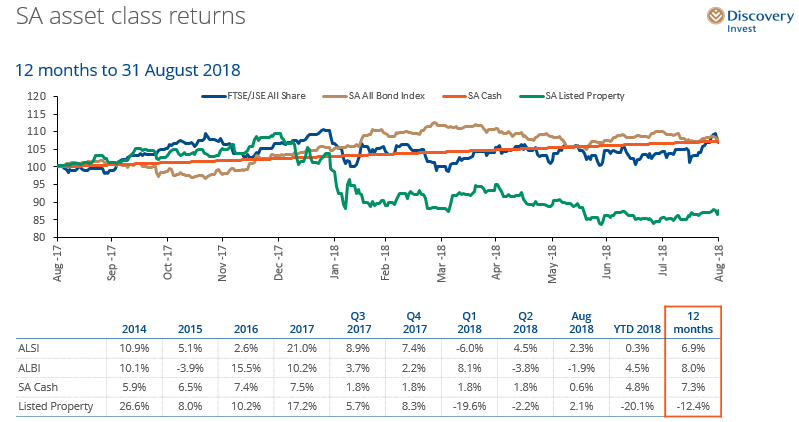
If you look below at the 12-month returns for the major asset classes to the end of August 2018, the lesson is that returns do not arrive in a nice smooth line – and they never have.
Those who have lost courage in the past have paid very dearly for doing so. For example, in 2015, it would have been very tempting for investors to sell out of bonds when it gave them a negative return of 3.9%.
However, that would actually have been a good time to buy bonds, which were great value because in 2016 they gave investors 15.5%. Similarly, if investors switched into the All Share market at the end of 2015, they would have been disappointed in 2016, when it delivered half the previous year's return. But if they switched out of the All Share market based on that performance, they would have missed a 21% return in 2017.

Source: Bloomberg, to 31 August 2018
Although the last 12 months have been extremely difficult, the nature of markets is that they are volatile. The short-term pain is what you pay for the long-term gain.
History lesson three: Trying to time the market, and not sticking to an investment plan, can be very costly
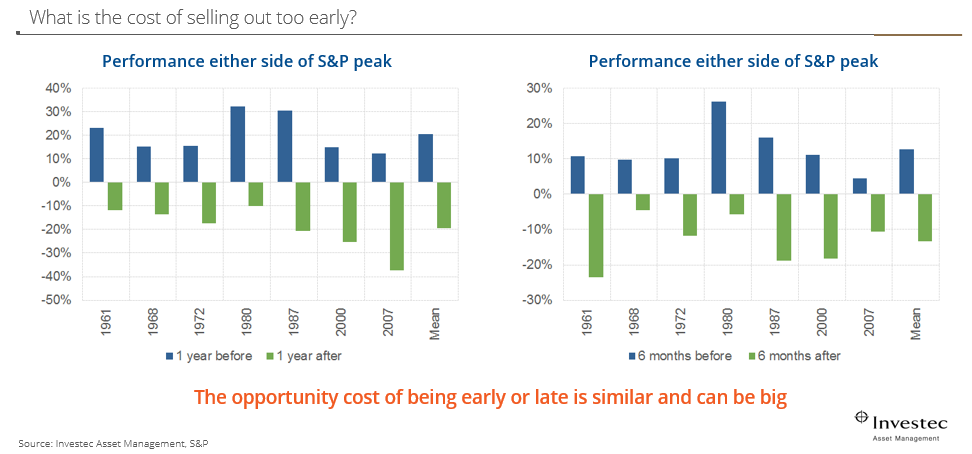
In the graph below you can see what happens if investors sell one year before the peak. The blue bars on the left graph show you how much performance is missed and the green bars show how much investors lose if they sell one year too late. For example, if you sold out in 1972 when the market made a loss of almost 20%, you would have missed out on a gain of more than 30% the following year.
Looking at the second graph, if you sold out in 2007, after a 10% loss, you would have missed a gain of more than 10% six months later. Trying to time the market often means that you sell too early or wait too long, and there is a similar cost.

Source: Standard & Poor's, asset class returns from 1961 to 2007
To reap the benefits of long-term investing, investors must stay the course. It's rare that plans fail investors, and far more common that investors fail plans.
Why Discovery Invest should be your partner of choice
Despite the current difficult economic environment:
- The Discovery Balanced Fund had a return of 9.07% for the year to end August 2018 against a benchmark return of 3.80%2
- The Discovery Diversified Income Fund had a return of 8.47% for the year to end August 2018 against a benchmark return of 7.29%2
- Our flagship fund, the Discovery Balanced Fund, was the 7th biggest flow taker in the industry, with net flows of R989 million for the second quarter of 2018, making it the 12th biggest retail fund out of more than 1 000 funds in the country (excluding money market funds), as per ASISA (www.asisa.co.za)3
- The Plexcrown Survey for quarter two 2018 shows Discovery Invest retaining a place among the top five asset managers in the country4.
These accomplishments should reassure clients that their investments are in the right place and there is no need to venture off track by reacting to short-term market movements or downward cycles.
- Investec Asset Management
- 1Returns sourced from Bloomberg for period from 01 January 2018 to end August 2018
- 2Returns from Profile Data to the end of August 2018
- 3https://www.asisa.org.za/media-release/local-cis-industry-grows-investor-assets-to-r2-3-trillion/
- 4Plexcrown Survey for quarter two 2018: http://www.plexcrown.co.za
- Bloomberg, to 31 August 2018
- Bloomberg, to 31 August 2018
- Standard & Poors, 1961 to 2007.
Disclaimer
Nothing contained herein should be construed as financial advice and is meant for information purposes only. Discovery Life Investment Services Pty (Ltd): Registration number 2007/005969/07, branded as Discovery Invest, is an authorised financial services provider.
What to know before investing in collective investment schemes (unit trusts)
Before you invest in a collective investment scheme, there is important information you should know. This includes how we calculate the value of your investment, what affects the value of your investment, and investment charges you may have to pay. This notice sets out the information in detail. Speak to your financial adviser if you have any questions about this information or about your investment.
What the investment is
This Fund is a Collective Investment Scheme (also known as a unit trust fund) regulated by the Collective Investment Schemes Control Act, 45 of 2002 (CISCA). Collective investment schemes in securities are generally medium- to long-term investments (around three to five years).
Who manages the investment?
Discovery Life Collective Investments (Pty) Ltd, branded as Discovery Invest, is the manager of the Fund. Discovery Invest is a member of the Association of Savings and Investment South Africa (ASISA).
You decide about the suitability of this investment for your needs
By investing in this Fund, you confirm that:
- We did not provide you with any financial and investment advice about this investment
- You have taken particular care to consider whether this investment is suitable for your own needs, personal investment objectives and financial situation.
You understand that your investment may go up or down
1. The value of units (known as participatory interests) may go down as well as up.
2. Past performance is not necessarily an indication of future performance.
3. Exchange rates may fluctuate, causing the value of investments with international exposure to go up or down.
4. The capital value and investment returns of your portfolio may go up or down. We do not provide any guarantees about the capital or the returns of a portfolio.
How we calculate the unit prices and value the portfolios
1. We calculate unit trust prices on a net-asset value basis. (The net asset value is defined as the total market value of all assets in the unit portfolio, including any income accrued and less any allowable deductions from the portfolio, divided by the number of units in issue.)
2. The securities in collective investment schemes are traded at ruling prices using forward pricing. (Forward pricing means pricing all buy and sell orders of units according to the next net-asset value).
3. We value all portfolios every business day at 16:00, except on the last business day of the month when we value the portfolios at 17:00.
4. For the money market portfolio, the price of each unit is aimed at a constant value. This means that all returns are provided in the form of a distribution and that a change in the capital value will be an exception and only due to abnormal losses.
5. Buy and sell orders will receive the same price for that day if we receive them before 11:00 for the money market portfolio and before 14:00for the other portfolios.
6. We publish fund prices every business day, with a three-day lag, on www.discovery.co.za
About managing the portfolio
1. The portfolio manager may borrow up to 10% of the portfolio's market value from any appropriate financial institution in order to bridge insufficient liquidity.
2. The portfolio manager can borrow and lend scrip.
3. The portfolio may be closed in order to be managed according to the mandate (if applicable).
Fees and charges for this investment
There are fees and other charges for this investment.
The fees and charges that apply to this investment are included in the net asset value of the units and you do not have to pay any extra amounts. These fees and charges may include:
- The initial fund management fee
- Commission
- Incentives (if applicable)
- Brokerage fees
- Market securities tax
- Auditor fees
- Bank charges
- Trustee fees
- Custodian fees
You can ask us for a schedule of fees, charges and maximum commissions.
The total expense ratio
- "Total Expense Ratio" means a measure of a portfolio's assets that have been expended as payment for services rendered in the management of the portfolio or collective investment scheme, expressed as a percentage of the average daily value of the portfolio or collective investment scheme calculated over a period of a financial year by the manager of the portfolio or collective investment scheme.
- A percentage of the net asset value of the portfolio is for fees and other charges relating to managing the portfolio. The percentage is referred to as the total expense ratio (TER).
- A higher TER does not necessarily imply poor return, nor does a low TER imply good return.
- The current TER is not an indication of any future TERs. If fees go up, the TER is also expected to increase.
- During any phase-in period, the TERs do not include information gathered over a full year.
Transaction costs (TC)
1. Investors and advisers can use transaction cost (TC) as a measure to work out the costs they will incur in buying and selling the underlying assets of a portfolio.
2. The transaction cost is expressed as a percentage of the daily net asset value of the portfolio calculated over three years on an annualised basis. (This means the amount of interest an investment earns each year on average over three years, expressed as a percentage.)
3. Transaction cost is a necessary costs in administering the Fund. It affects the Fund's returns. It should not be considered in isolation as returns may also be affected by many other factors over time, including:
- Market returns
- The type of fund
- The investment decisions of the investment manager
- The TER.
4. Where a fund is less than one year old, the TER and transaction cost cannot be calculated accurately. This is because:
- The life span of the fund is short
- Calculations are based on actual data where possible and best estimates where actual data is not available.
5. The TER and the TC shown on the fund sheet are the latest available figures.