Continuous glucose monitoring leads to measurable improvement in people who have type 1 diabetes

In 2022, around (40%) of Discovery Health Medical Scheme members who live with type 1 diabetes mellitus claimed for continuous glucose monitors. These members had better blood sugar control and went to the hospital less often than those who didn't claim for these devices.
Authors
Discovery Health's: Vishrut Patel (Actuarial Analyst), Xolani Masombuka (Analyst), Nikash Bagirathi (Risk Manager), Claudia Pastellides (Actuary), Lara Wayburne (Senior Actuary), Amalia Theologides (Content Lead) and Shirley Collie (Chief Health Research Actuary).
How does continuous glucose monitoring technology enhance blood sugar checking?
Regular blood glucose monitoring is a crucial aspect of managing diabetes. People who live with diabetes monitor their blood sugar levels using one of two methods:
- Blood sugar test kits: Users prick the tip of a finger at intervals throughout the day using the lancet provided in the kit. They draw a drop of blood onto a test strip and insert it into a glucometer. The glucometer displays a reading within seconds. Typically, checks are done before and after meals, at bedtime, overnight, when exercising, or when starting new medicine. The frequency of readings varies based on individual tracking requirements. Results are recorded manually.
- Continuous Glucose Monitors (CGM): These devices may consist of a reader, a transmitter, and a sensor. The sensor, which has a small needle-like filament, is typically inserted into the upper arm, stomach, or thigh, and linked to an app. A CGM provides blood sugar readings at intervals throughout the day or on an ongoing basis. These are visible at a glance through the app related to the CGM device. The CGMs have been shown to be highly beneficial for children diagnosed with type 1 diabetes mellitus. These devices eliminate the need for repeat finger pricks, which can be very challenging for children. Caregivers can conveniently monitor glucose levels day or night - particularly useful while the child is asleep to ensure that their blood sugar remains within healthy ranges to avoid hypoglycaemia and hyperglycaemia. The linked apps also usually feature trend views, alarms for blood sugar highs or lows, and the capability to record and share data in real-time with healthcare providers.
Scheme-funded access to CGM devices for members living with T1DM
In 2021, Discovery Health Medical Scheme (DHMS) introduced a scheme-funded benefit for CGM devices for patients with Type 1 Diabetes Mellitus (T1DM).
- Type 1 diabetes mellitus (T1DM) is an autoimmune condition in which the body no longer produces insulin. Most people are diagnosed with T1DM as children.
Members can opt for a flash glucose monitor, which lasts for 14 days, or a real-time CGM, which has a lifespan of 7 to 14 days. As the names suggest, flash CGM monitors give a blood sugar reading when the sensor is scanned with a reader, on a smartphone app. Real-time CGM devices continuously analyse blood sugar levels, transmitting results to a linked app every few minutes and also providing alerts where blood sugar is too high or low.
- Discovery Health Medical Scheme (DHMS) members with T1DM are eligible for funding for CGM sensors, provided they have a referral from a doctor within the CGM provider network. The reader and transmitter are covered by day-to-day benefits.
- The CGM provider network is made up of Discovery Care Coordination (DCC) providers including doctors assigned to Scheme members enrolled on the DHMS Diabetes Care programme, as well as specialists and GPs who have postgraduate qualifications in diabetes care.
- Read up on how CGM use has benefited DHMS members Ethan Williams, Bella Hawkins and Emma Allen .
Investigating clinical outcomes and healthcare costs
We looked at DHMS members who claim for CGM devices and compared their healthcare costs and clinical outcomes with those of similar members who do not claim for these devices.
- What do we mean by 'claim'?
- We use the fact that members claim for CGM devices to mean they use CGM devices. We refer to them as 'claimants' throughout the analysis and compare them to 'non-claimants'
We looked at:
- HbA1c test results: In-range HbA1c results are classified as results equal to or below 8%. Data on time spent in-range was not available at the time of doing this analysis.
- Out-of-hospital costs
- All-cause hospital admissions
- Preventable Quality Indicators (PQIs): PQIs are measures that utilise hospital discharge data to identify admissions that could have been avoided with access to out-of-hospital care. The following PQIs are specifically focused on diabetes
- PQI 01: Diabetes Short-Term Complication Admission Rate
- PQI 03: Diabetes Long-Term Complication Admission Rate
We also considered these confounding variables (factors that affect risks and outcomes):
- Age
- Sex
- DHMS plan option
- Comorbidities that influence the risk of adverse outcomes - like living with cancer, chronic renal failure or ischemic heart disease
Collectively, we call the combination of these confounders the disease burden index.
How many Scheme members living with T1DM claim for a CGM?
The number of DHMS members registered for T1DM increased from 6,133 in 2018 to 7,406 in 2022.
The proportion of these members claiming for a CGM device rose from 10% (636 members) in 2018 to 36% (2677 members) in 2022 - a 321% increase from 2018 to 2022.
Looking at the 2020 to 2021 period, there was a 111% relative increase in CGM claims (17% to 36%) - Figure 1. This surge is associated with the introduction of the CGM scheme-funded benefit and provider network in 2021 (explained above).
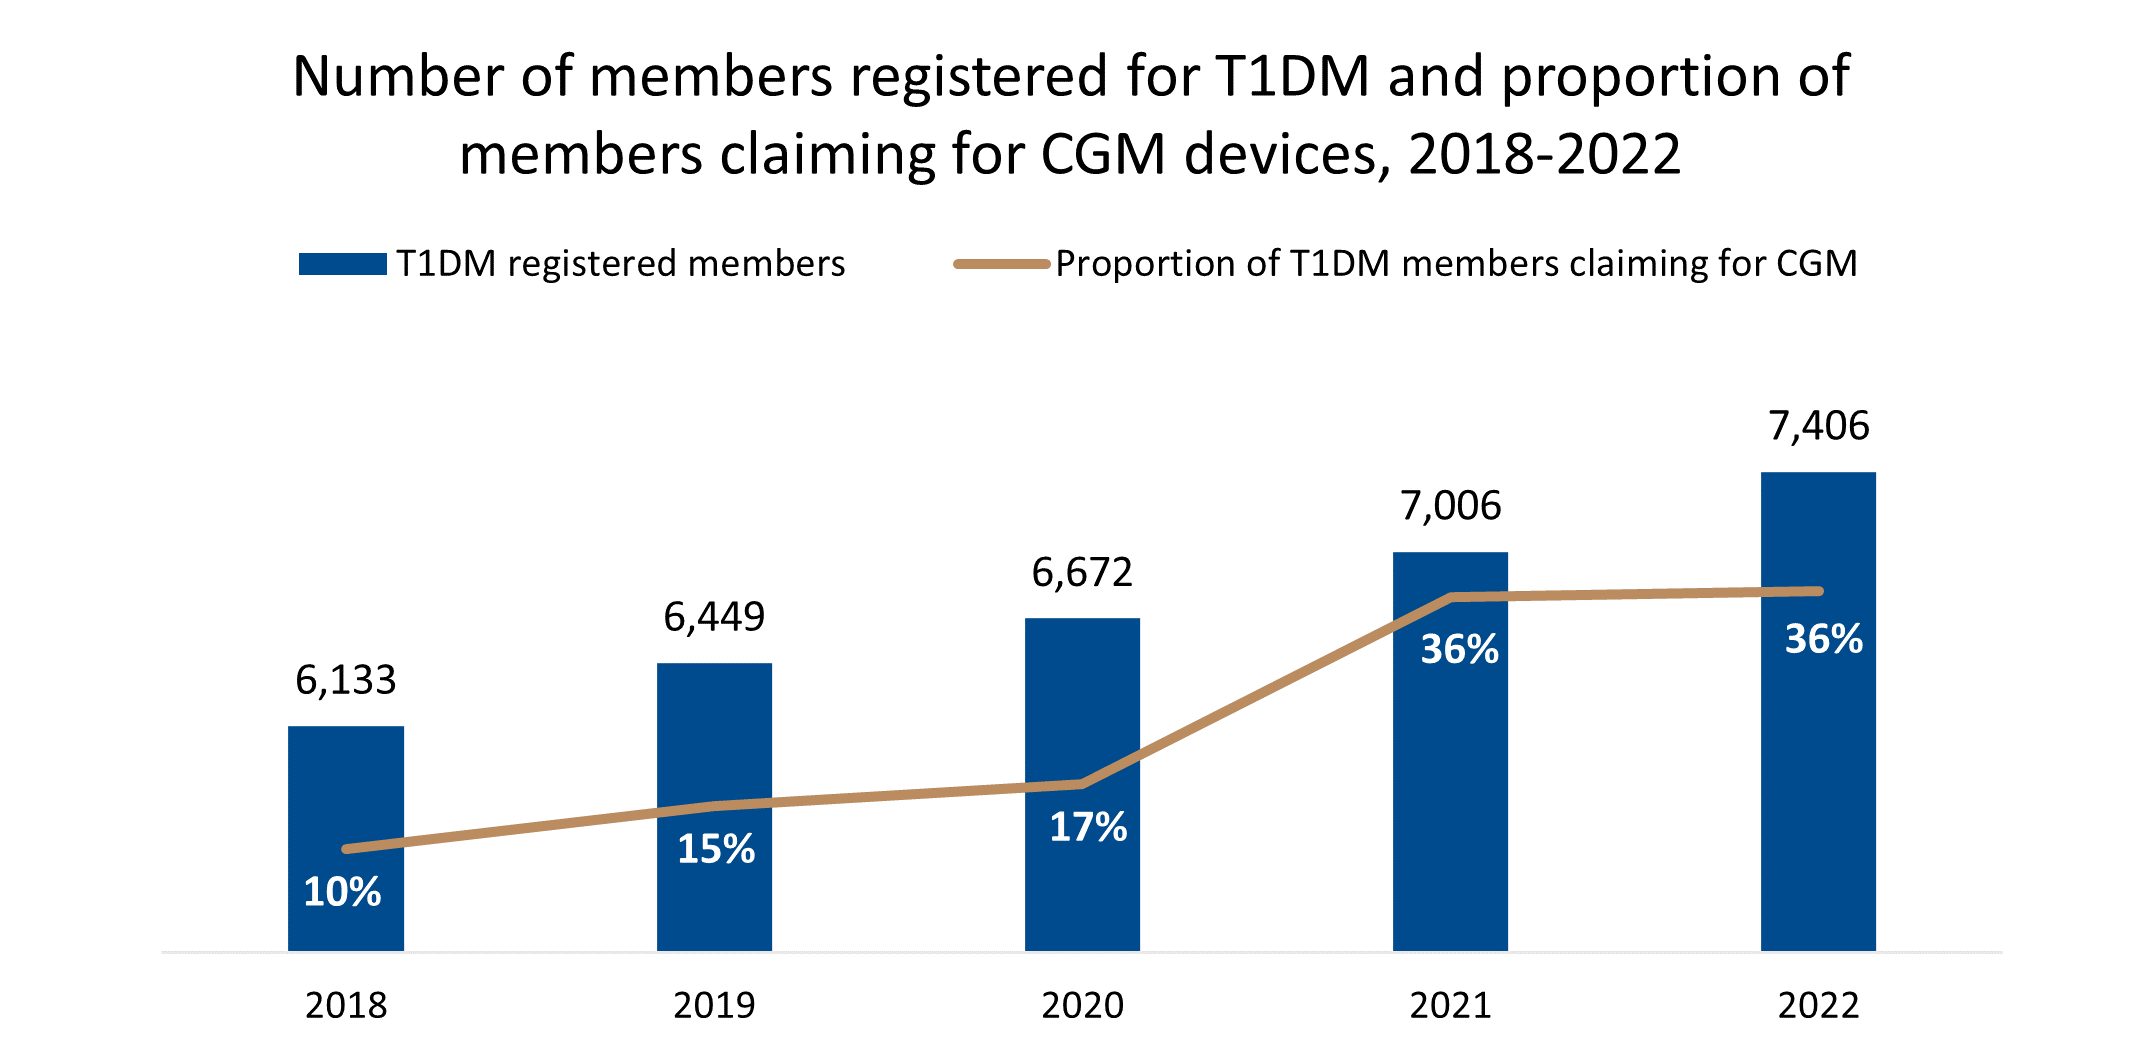
Figure 1: Number of members registered for T1DM and proportion of members claiming for CGM devices, 2018-2022
The distribution of male and female CGM claimants from 2018 to 2022 has remained steady (2,677 members claimed in 2022 - 51% female and 49% male).
More child Scheme members claim for CGMs than adults
Among DHMS members living with T1DM, more children who have the condition are claiming for CGM devices than adults (Figure 2). In 2022, 30% of adult DHMS members living with T1DM claimed for a CGM device, compared to 69% of child members living with the condition (Figure 3).
Looking at all members living with T1DM and claiming for a CGM device, 67% are adults (i.e. over the age of 18):
-
- Adult claimants more than doubled from 2020 to 2021 (a 107% increase) due to the new scheme-funded benefit mentioned above. From there the number of adult claimants remained stable from 2021 to 2022.
- Child claimants more than doubled from 2020 to 2021 (a 136% increase) due to the new scheme-funded benefit. From there, the number of child claimants remained stable from 2021 to 2022.
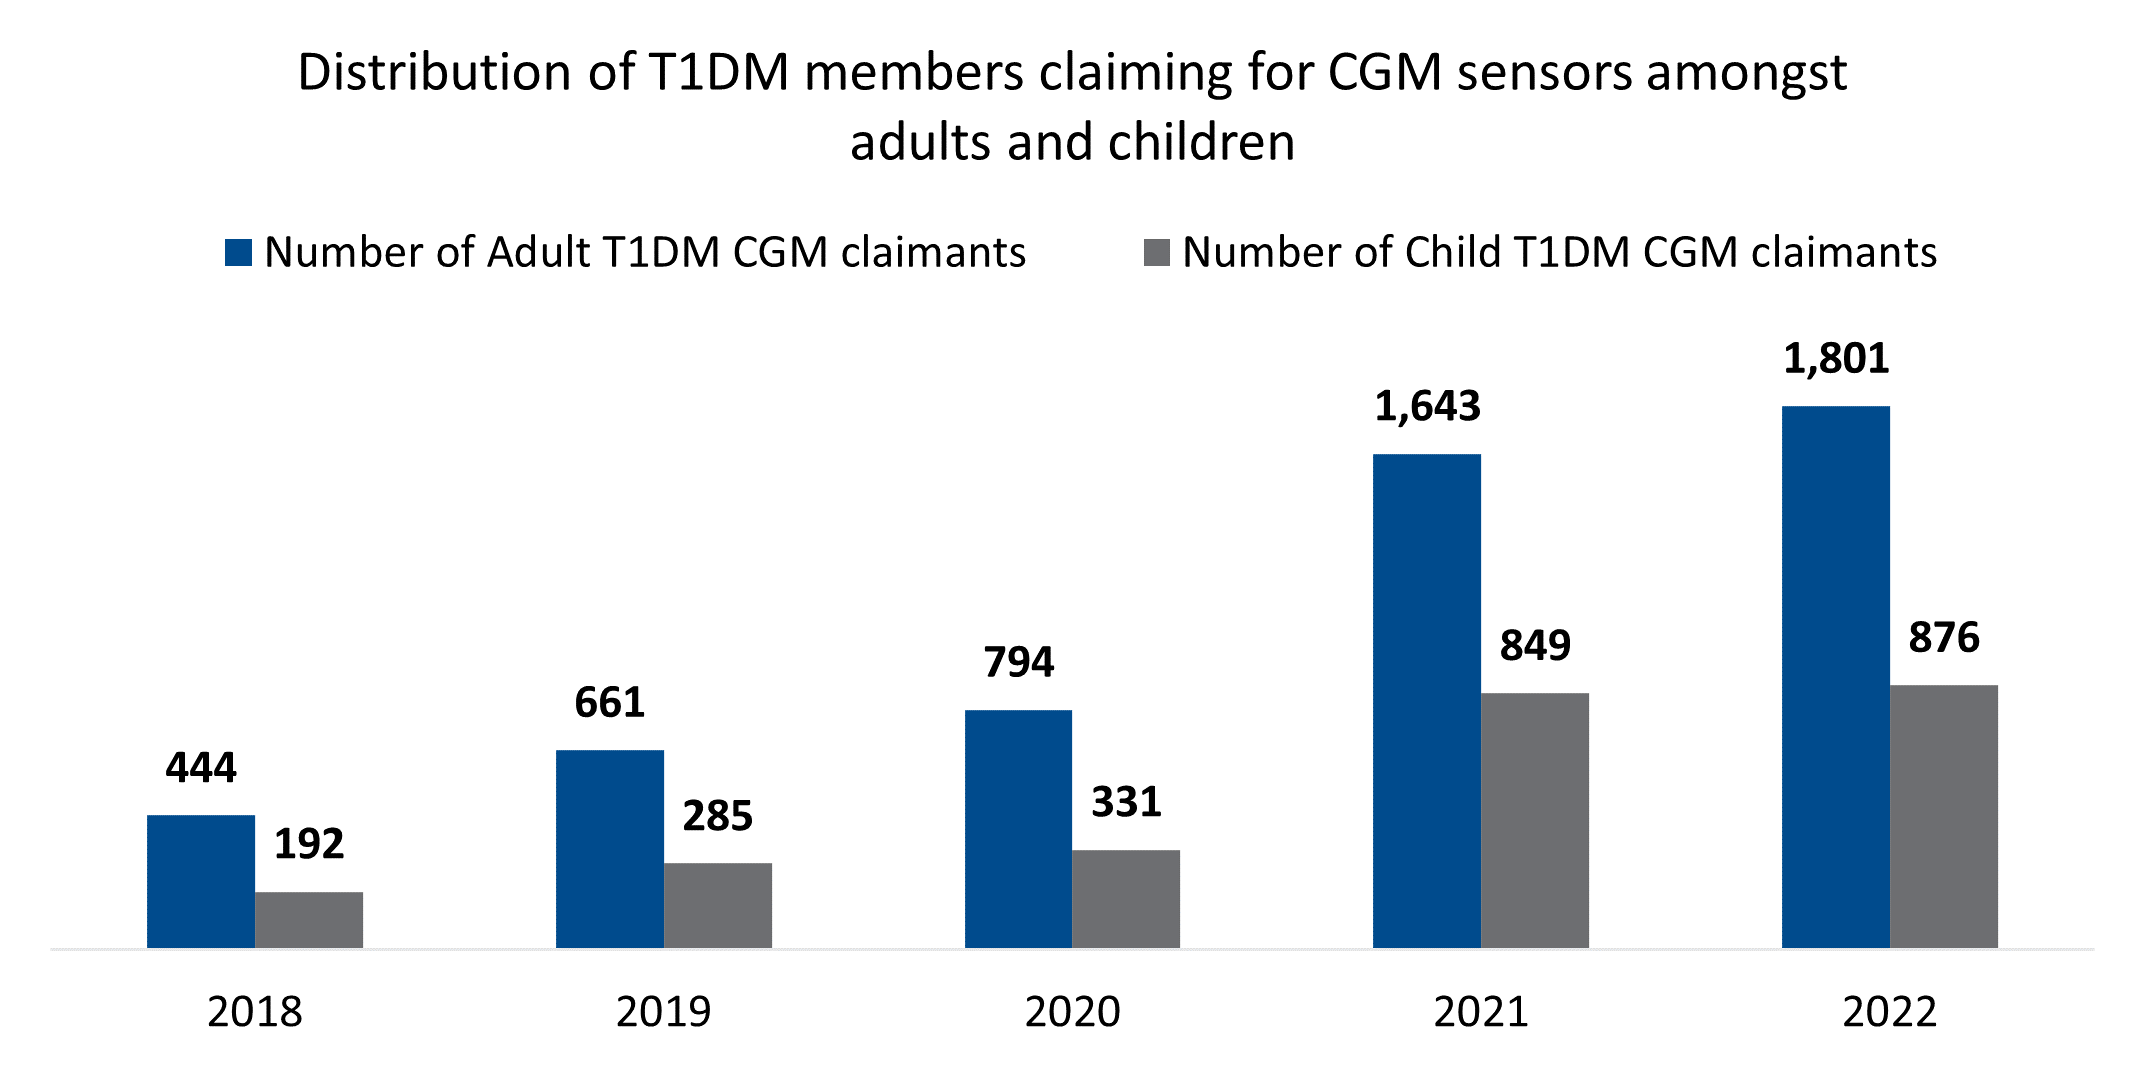
Figure 2: Number of adult and child T1DM CGM claimants 2018-2022
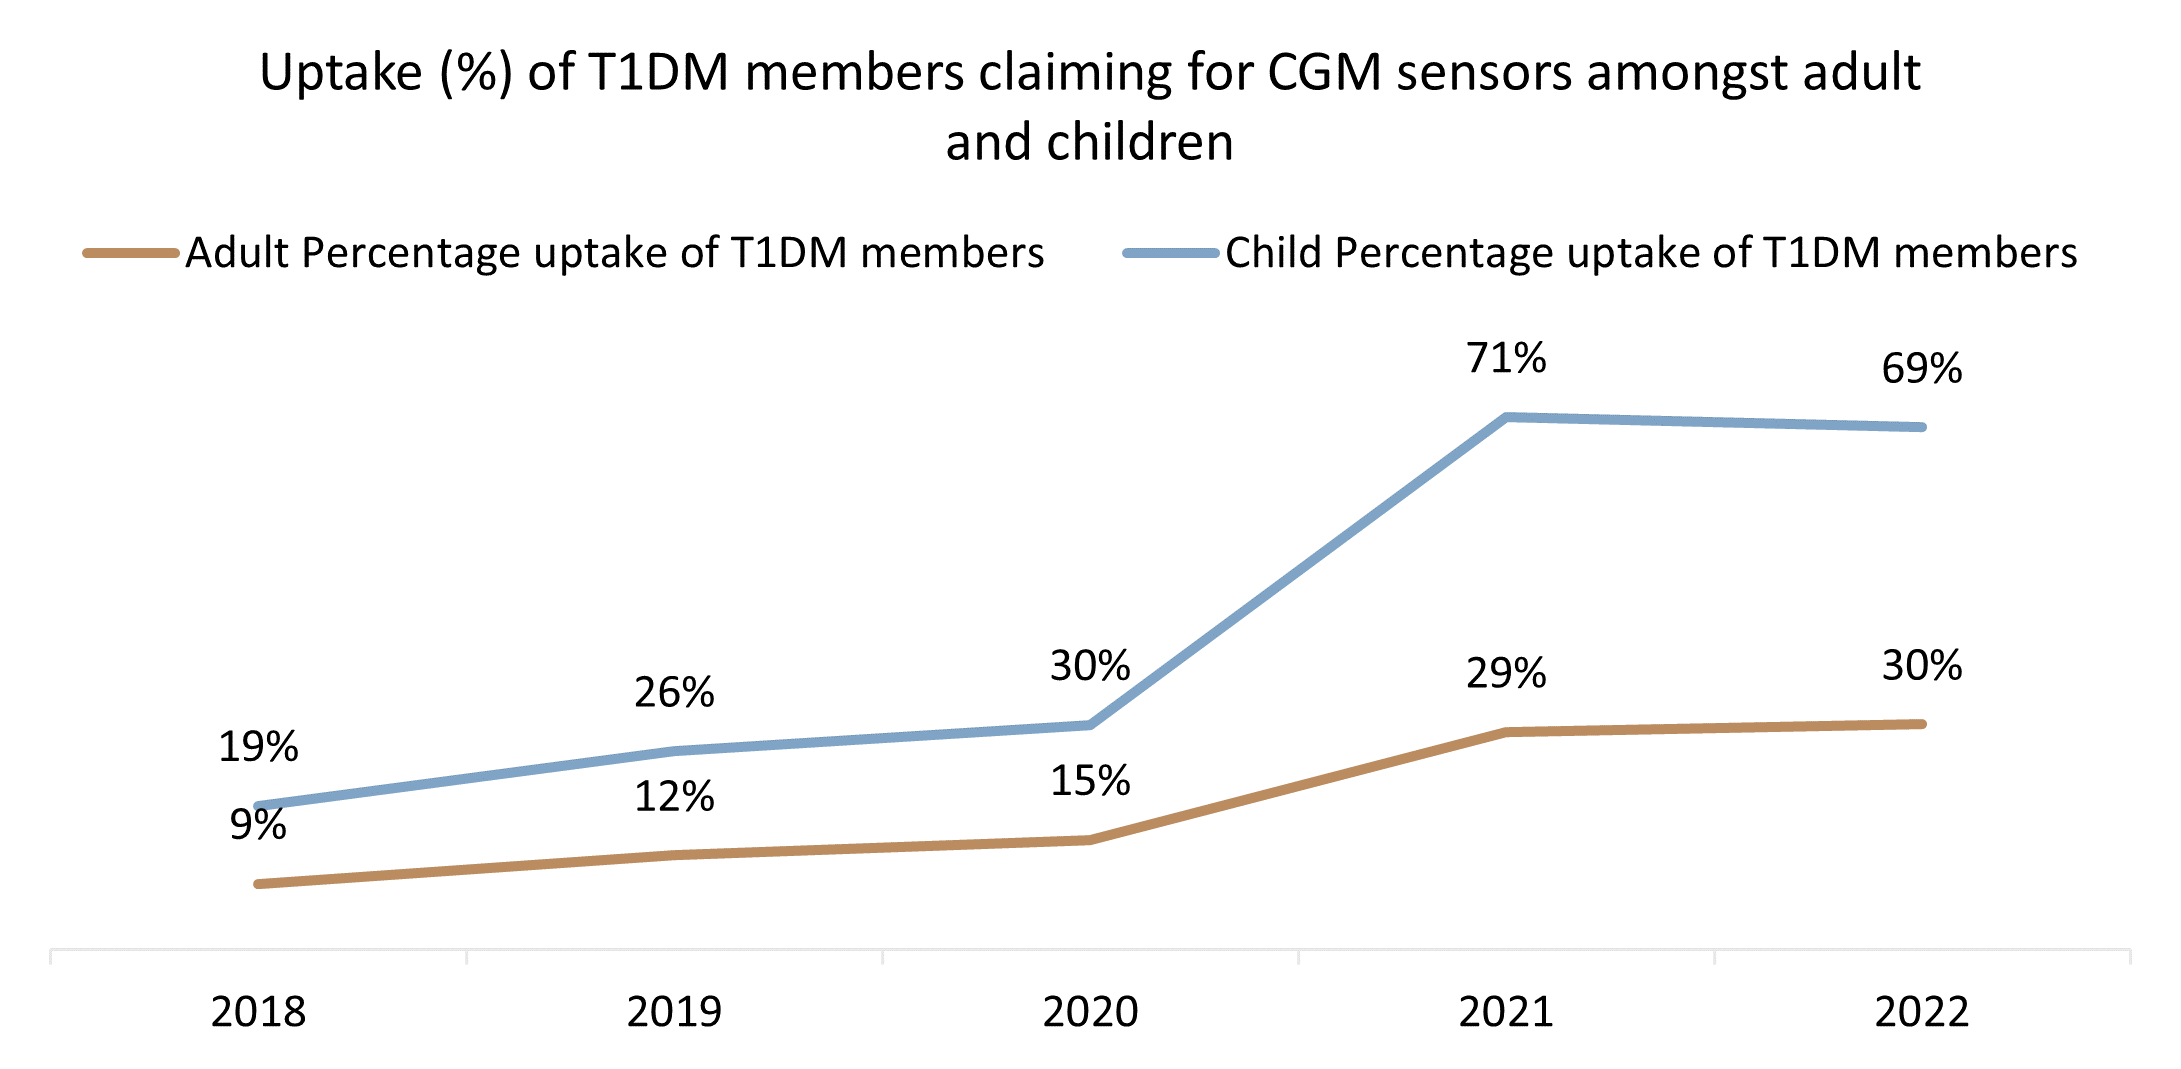
Figure 3: Proportion of T1DM claiming for CGM devices amongst adults and children 2018-2022.
What types of CGM devices do members use?
In 2022, most members living with T1DM and claiming for CGM devices (63%) claimed for flash glucose monitors (Figure 4). As of March 2024, the flash glucose monitor was replaced by (the CGM device supplier) with a real time CGM device.
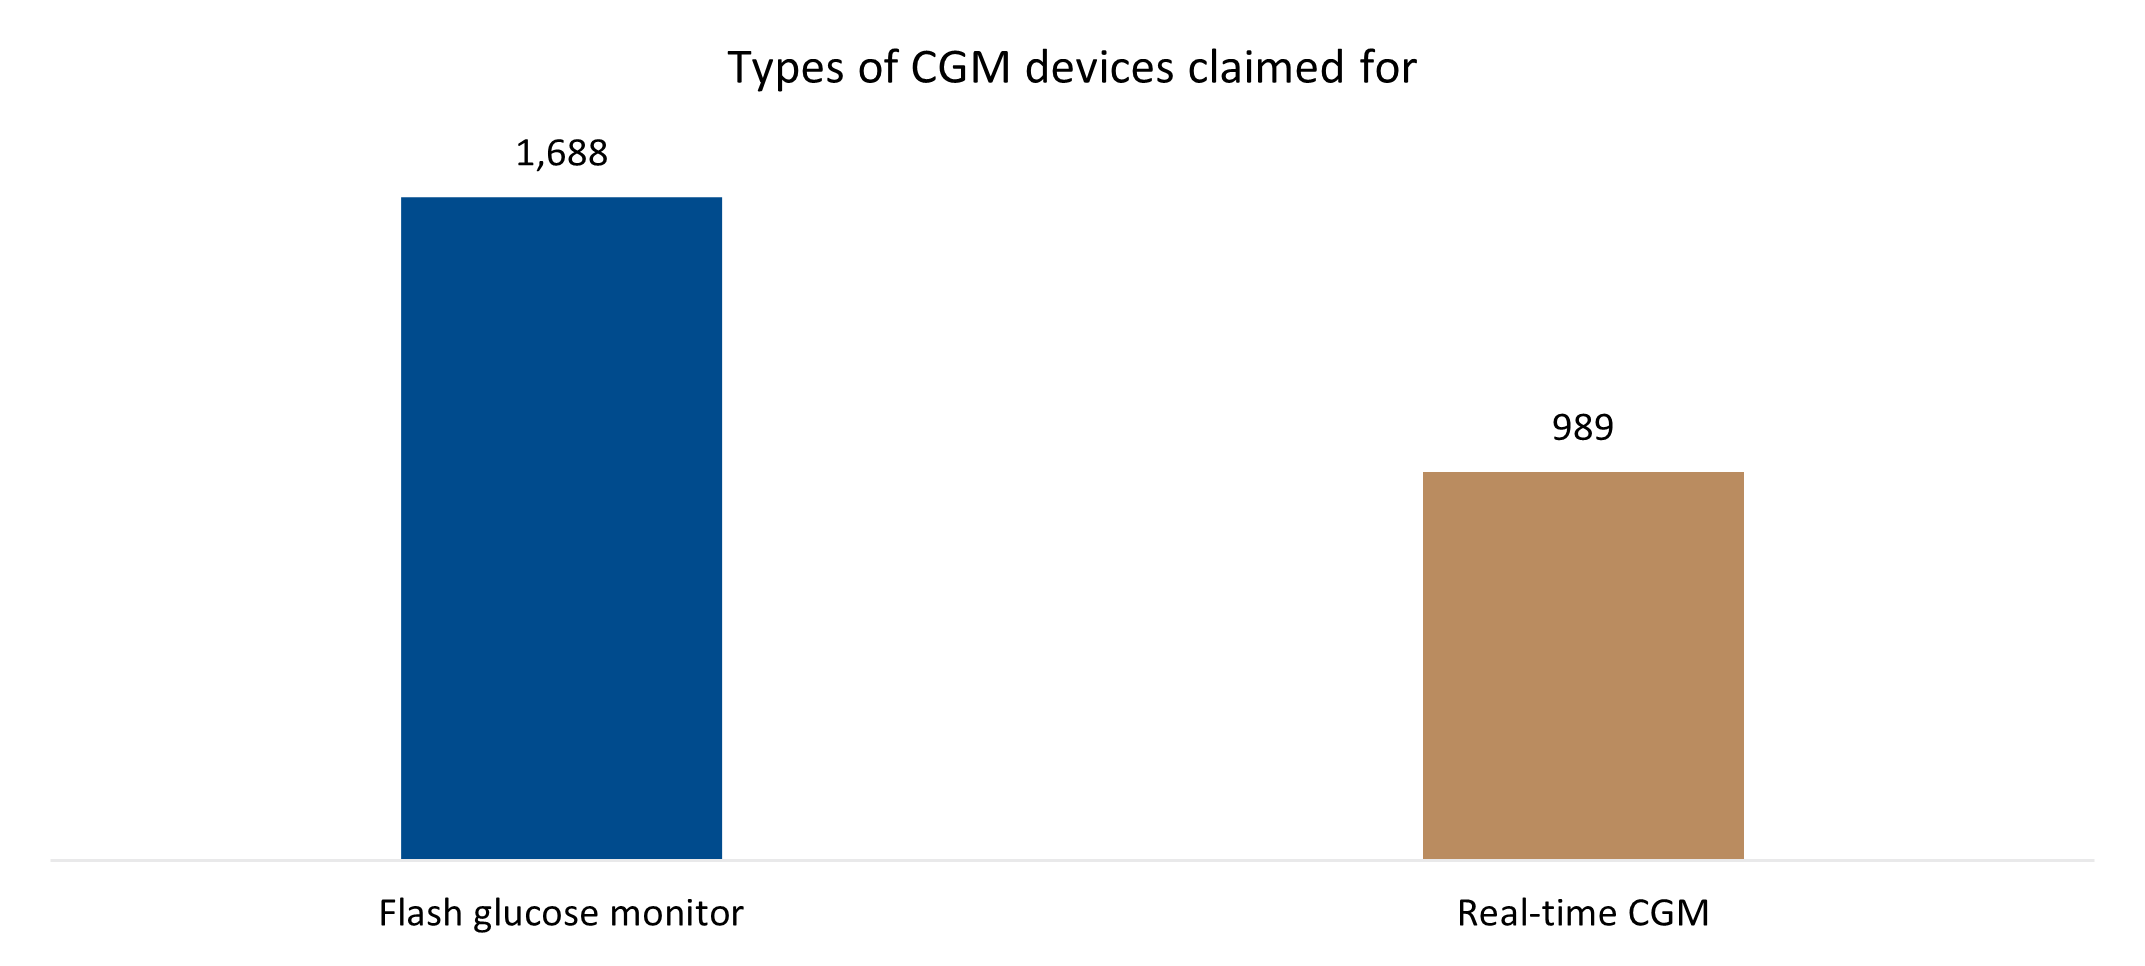
Figure 4: Types of CGM devices claimed for in 2022
How does CGM device use affect HbA1C levels?
Glycated haemoglobin (HbA1c) develops naturally when haemoglobin (which carries oxygen in our blood and is found on red blood cells) binds to glucose in the blood. The amount of glucose that attaches to haemoglobin is proportional to how much sugar is in your blood at the time. As red blood cells survive in the body for up to 12 weeks, measuring HbA1c can show average glucose levels over time, giving doctors a good long-term measure of blood glucose control in a patient.
From 2019 to 2022 there was a 12% higher rate of in-range HbA1c results among members claiming for CGM devices (Figure 5) than for non-claimants.
- Among members claiming for CGM devices, 69.9% had an in-range HbA1c test result (HbA1c of less than 8%).
- Among members not claiming for CGM devices, 57.9% had in-range results.
Over the same period:
- Among members claiming for CGM devices, 71.7% of adults and 64.9% of the children had in-range HbA1c test results.
- Among members not claiming for CGM devices, 60.1% of adults and 39.2% of children had in-range HbA1c results.
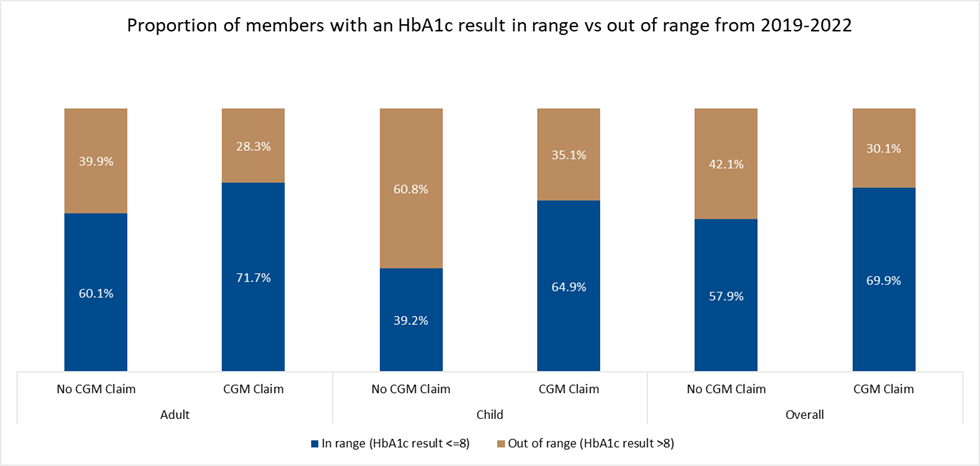
Figure 5: Proportion of CGM claimants vs non-CGM claimants with an HbA1c result in-range vs out-of-range from 2019-2022.
We also compared in-range HbA1c results by comparing results from:
- DHMS members who didn't claim for a CGM device in 2021 and 2022
- members who started claiming for CGM device in 2022 and
- Members who claimed for a CGM device in both 2021 and 2022
Table 1 shows the change in absolute HbA1c results, median changes and proportions in-range across these groups.
The median change in HbA1c is calculated as:
Change in HbA1c (%) = HbA1c result in 2022 (%) - HbA1c result in 2021 (%)

Table 1: Number of members, median HbA1c and proportion of entities with in-range results among a) members who did not claim for CGM in 2021 and 2022 b) members who did not claim for CGM in 2021 but did claim for CGM in 2022 c) members who claimed for CGM in 2021 and 2022.
Table 1, column 1: Among Scheme members who did not claim for a CGM device in either 2021 or 2022 the median change in HbA1c results over the period was 0.0% for adults and a 0.1% increase in HbA1c for children. Here, 51% of adults and 28% of children had an in-range HbA1c result.
Table 1, column 2: Among members who started claiming for a CGM device in 2022, the median change in HbA1C results for adults was a 0.2% decrease (favourable) and for child members was a 0.15% increase (note that the change in median HbA1C results among children is volatile due to the low volumes of children in this group). And, in this group 54% of adults and 38% of children achieved glucose control (in-range HbA1c results) in 2021/2022.
Table 1, column 3: For members who claimed for a CGM device in both 2021 and 2022, the median change in HbA1c results for adults was a 0.1% decrease and for children was a 0.0% change. This group had the highest proportion of members achieving glucose control, with 71% of adults and 55% of children recording in-range HbA1c results. These results illustrate the benefits of continued glucose monitoring which is possible through CGM use.
Looking into age, sex and disease burden among DHMS members using CGM devices and non-users
Figure 6 shows the distribution of CGM and non-CGM users across various DHMS member age bands. The data show that members claiming for CGM devices are younger than non-claimants.
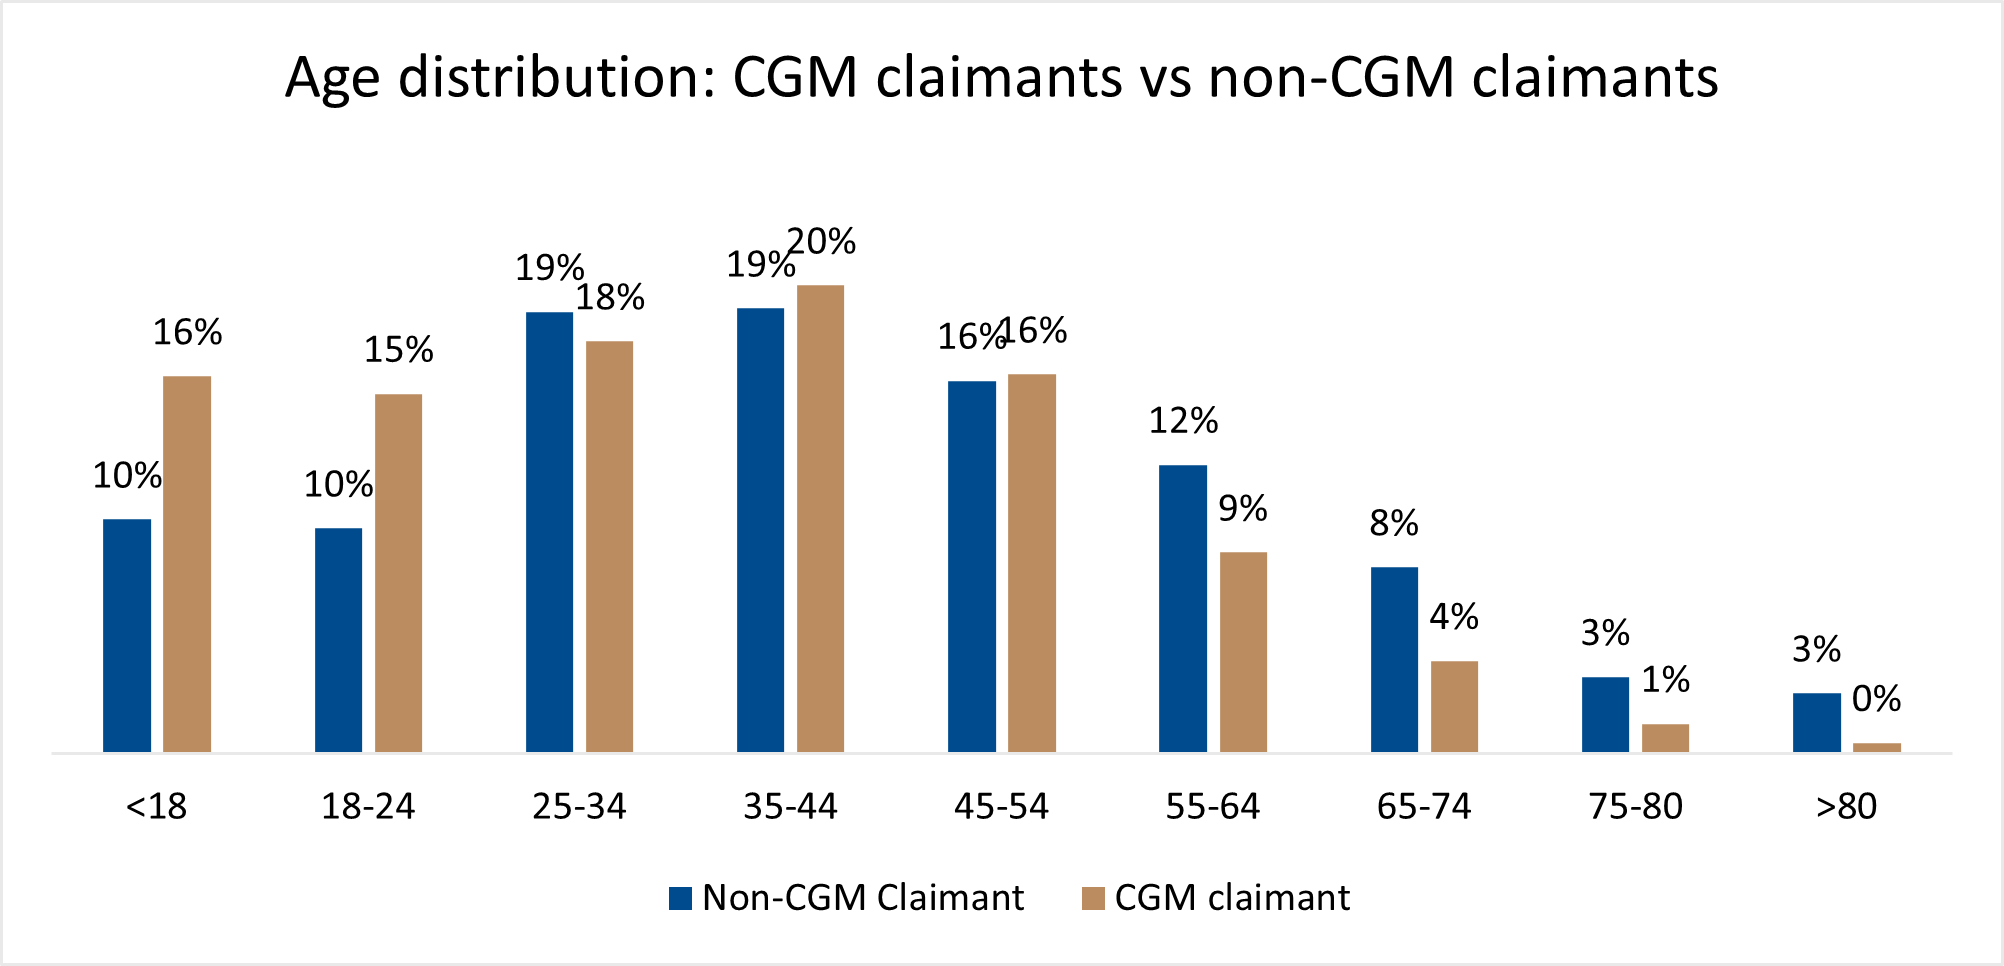
Figure 6: Age-band distribution for CGM claimants vs non-CGM claimants.
Figure 7 shows that there is a 15% higher proportion of female CGM claimants than female non-CGM claimants and a 12% lower proportion of male CGM claimants than non-CGM claimants.
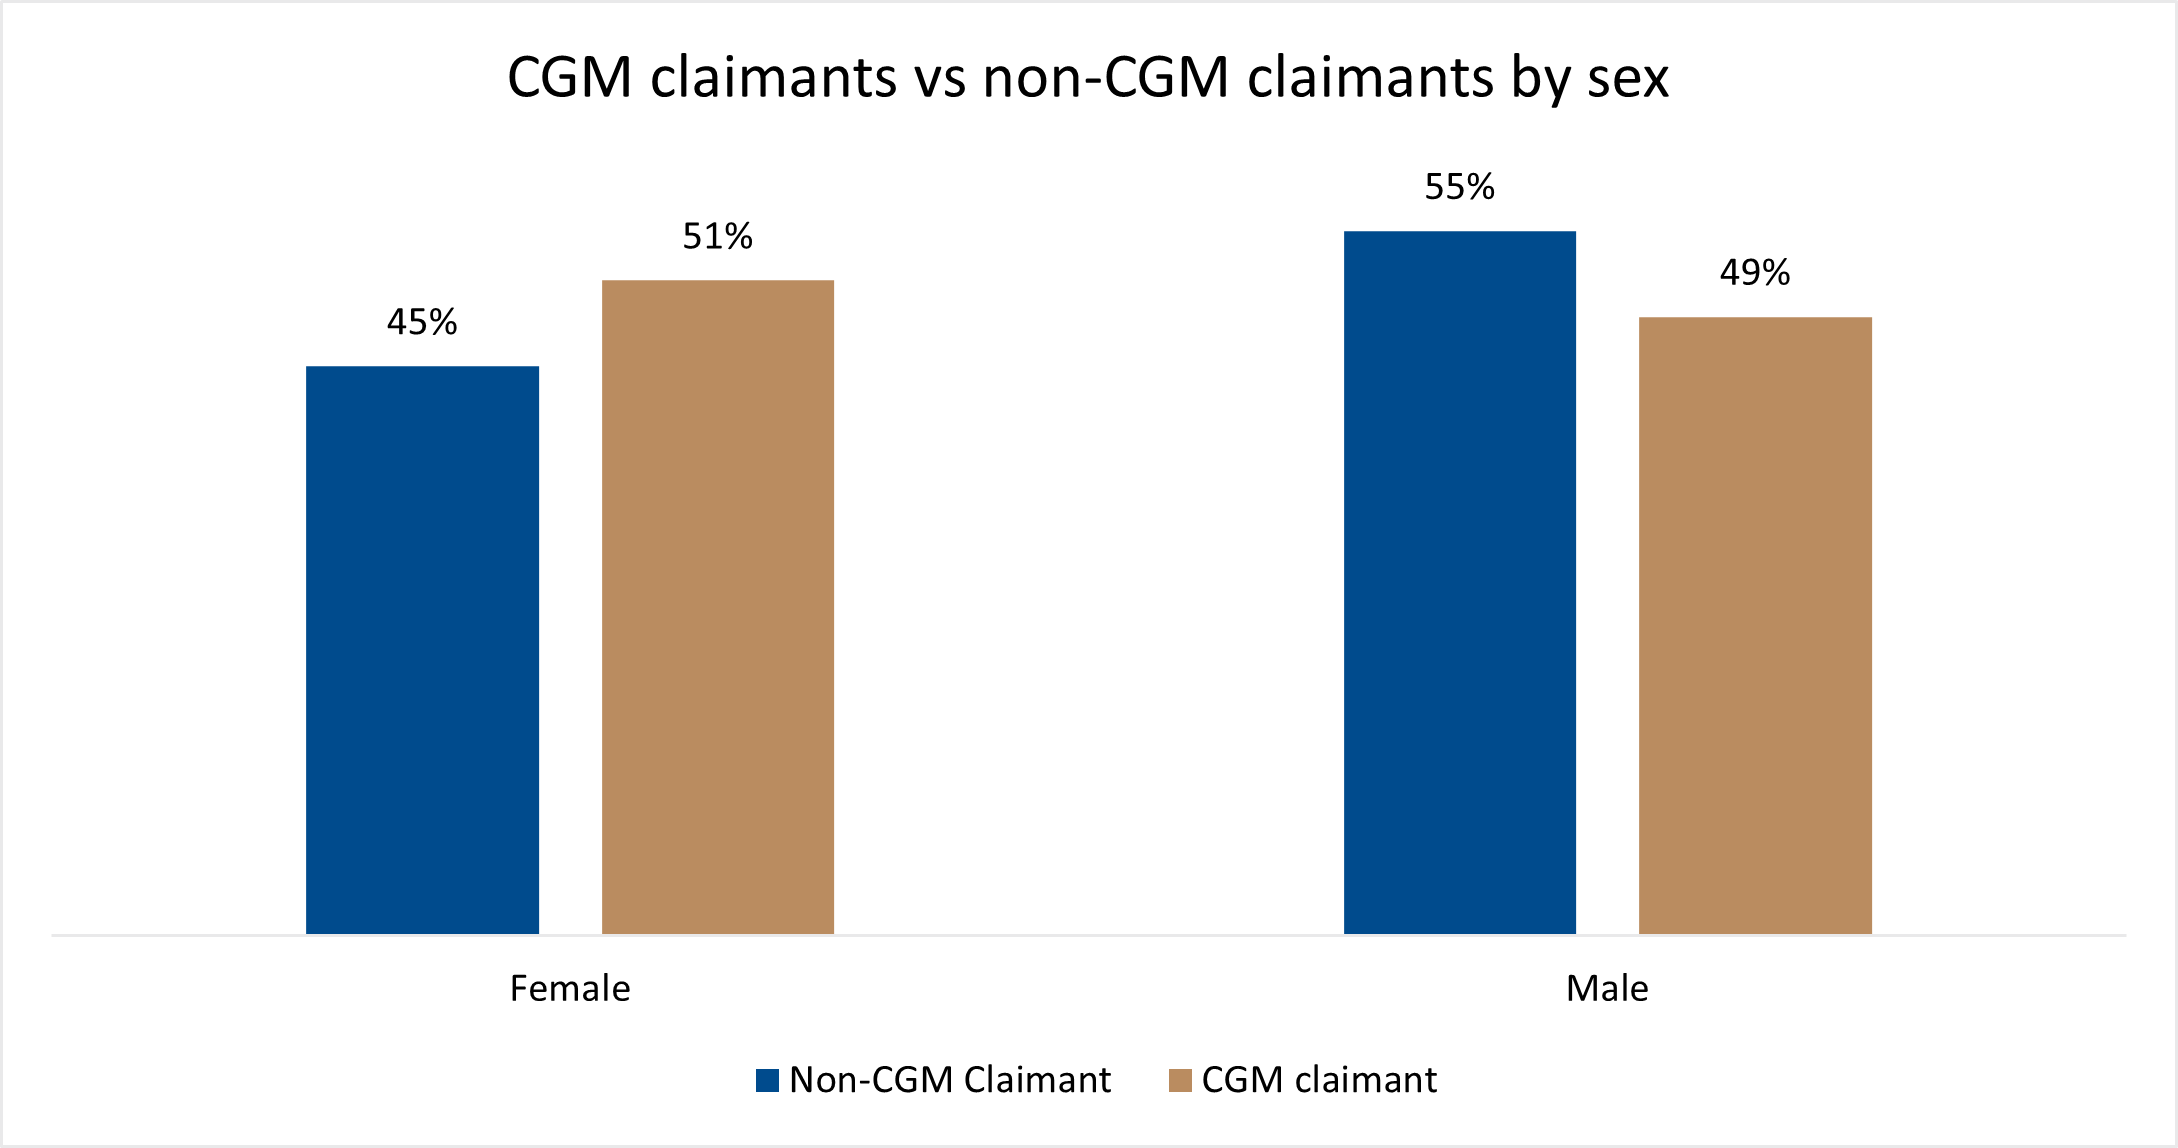
Figure 7: Male vs female CGM claimants vs non-claimants - distribution
Figure 8 shows the proportion of Scheme members who are registered on the DHMS Chronic Illness Benefit for T1DM and also for hypercholesterolaemia, oncology (cancer), chronic renal failure, or ischemic heart disease - again for CGM claimants versus non-claimants. Most of the members registered for T1DM and either hypercholesterolaemia, chronic renal failure or ischemic heart disease are not CGM claimants. A similar proportion of CGM-claimants and non-claimants are registered for cancer.
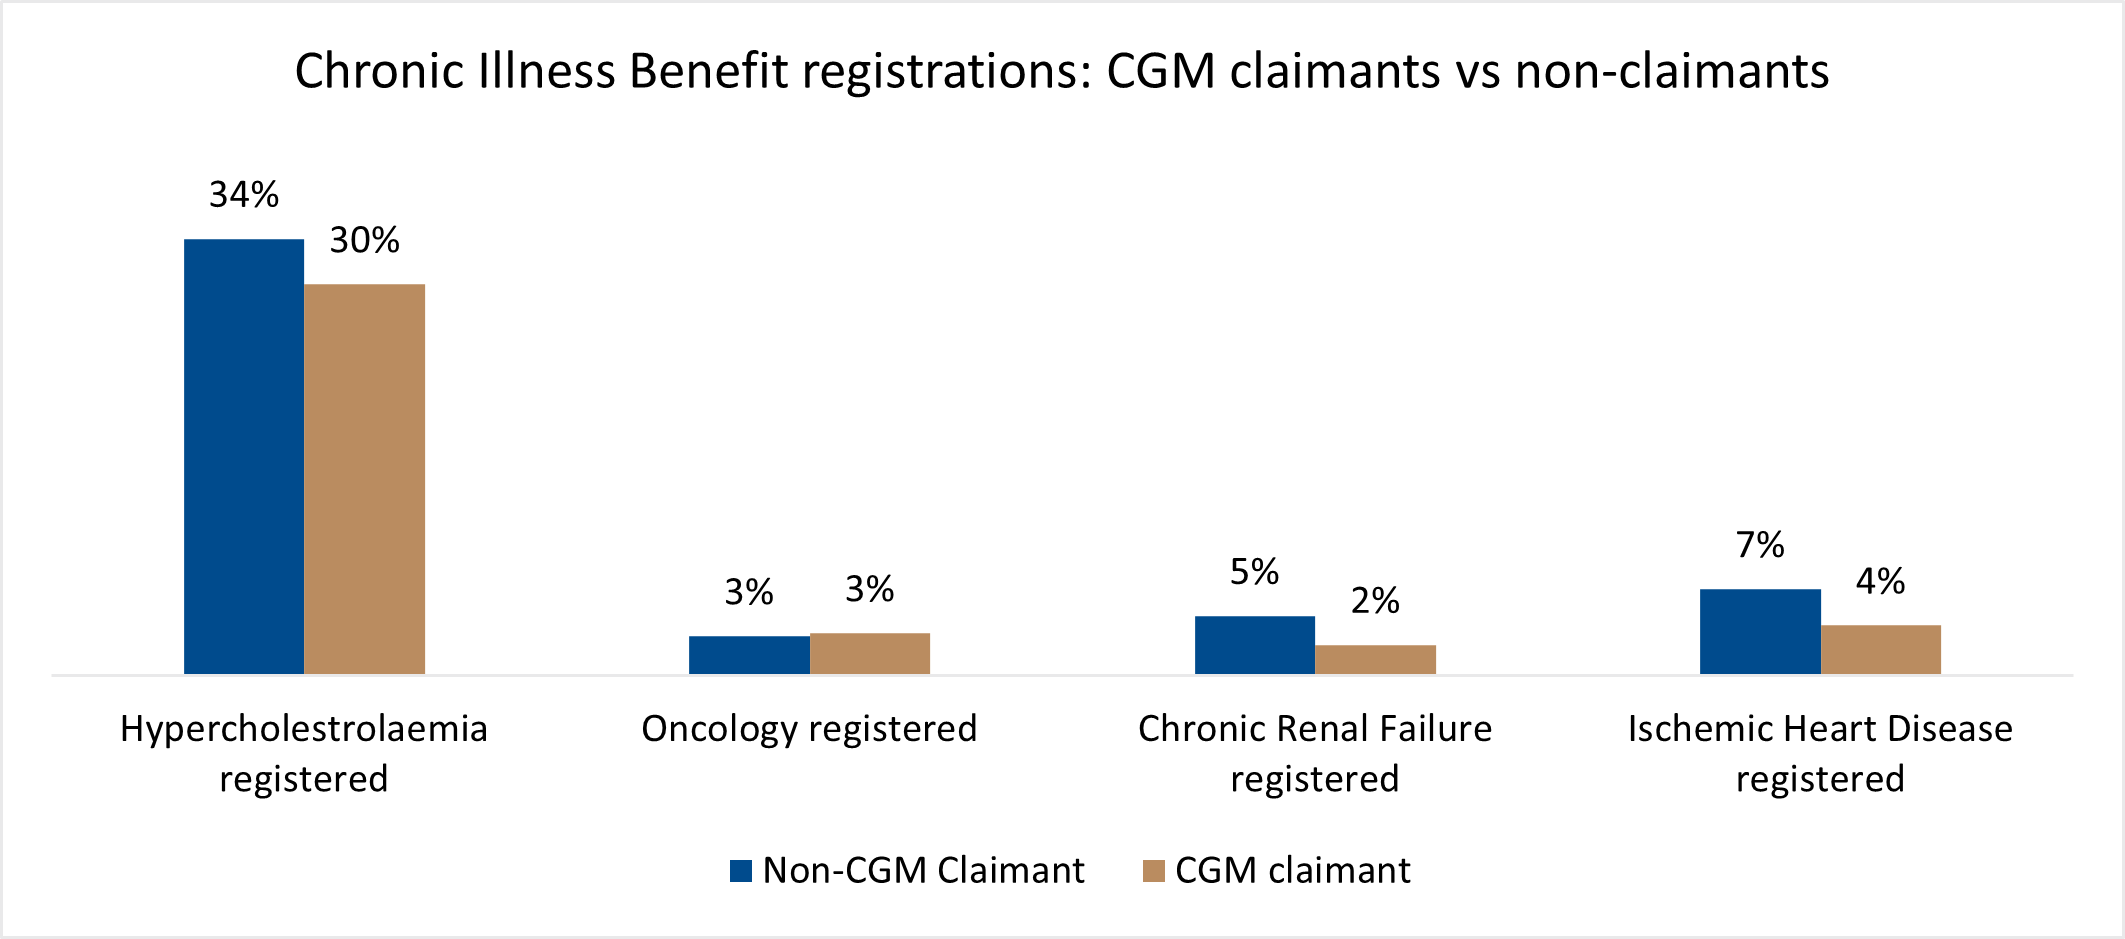
Figure 8: Chronic condition registrations - CGM claimants vs non-CGM claimants
Figure 9 shows disease burden among child and adult CGM claimants and non-CGM claimants. As mentioned earlier in this analysis, CGM claimants tend to be young Scheme members. Younger people also tend to have fewer chronic conditions. Adult CGM claimants have a lower disease burden compared to non-CGM claimants.
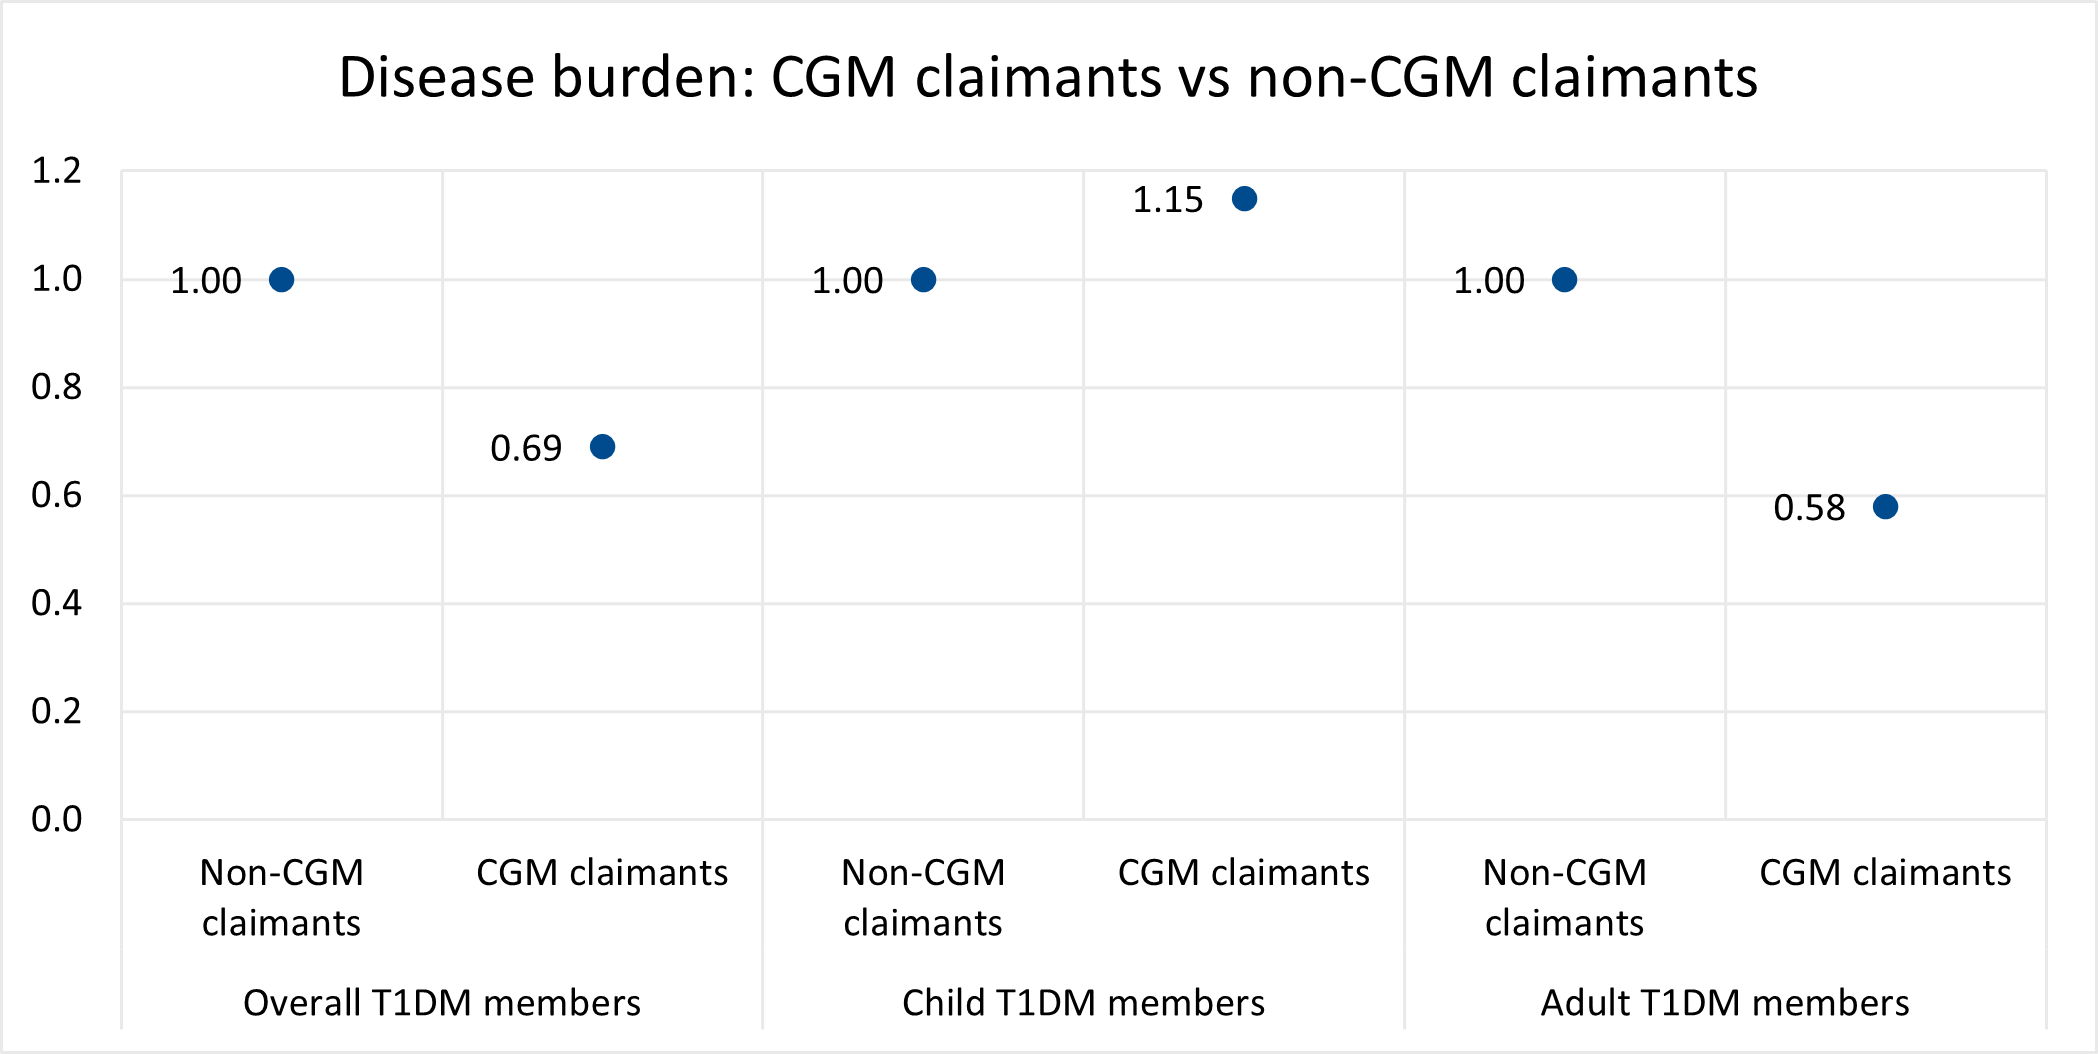
Figure 9: Disease burden for CGM vs non-CGM claimants split between the overall, child and adult populations
Admission rates: Comparing members claiming for CGM devices to non-claimants
Looking at all members registered for T1DM:
From 2019 to 2022 DHMS members living with T1DM who claimed for a CGM device had an admission rate of 45% versus 65% for non-claimants (Figure 10).
Earlier in this analysis we explained that we call the combination of the confounders we looked at our disease burden index (DBI).
Overall, members claiming for CGM devices have a DBI of 0.69 and non-claimants a higher DBI, at 1.00. So CGM claimants have a lower disease burden than non-claimants. When admission rates were adjusted to account for DBI, we saw that admission rates were still lower for CGM claimants (5.41% lower) than for non-claimants.
Looking at adults registered for T1DM:
Figure 10 shows that (before adjusting for DBI) adult CGM claimants have a lower 51% admission rate compared to a 67% admission rate for non-claimants (Figure 10). Comparing DBI between adult CGM and non-CGM claimants we saw that CGM claimants had a DBI of 0.58 versus 1.00 for non-claimants. So, in line with our findings on the overall member group, the adult CGM claimants in the group have a lower DBI than non-claimants. When admission rates were adjusted to account for DBI, we saw that adult CGM claimants still had a lower admission rate (4.48% lower) than non-claimants.
Looking at children registered for T1DM:
Figure 10 shows that (before adjusting for DBI) child CGM-claimants have a 26% admission rate compared to a 43% admission rate for non-claimants. Looking at DBI we saw that CGM claimants have a DBI of 1.15 whereas child non-CGM claimants had a DBI of 1.00. This implies that child CGM claimants have a higher disease burden than those not claiming for CGM devices. When admission rates were adjusted to account for DBI, we saw that child CGM claimants had a 1.9% lower admission rate than non-claimants.
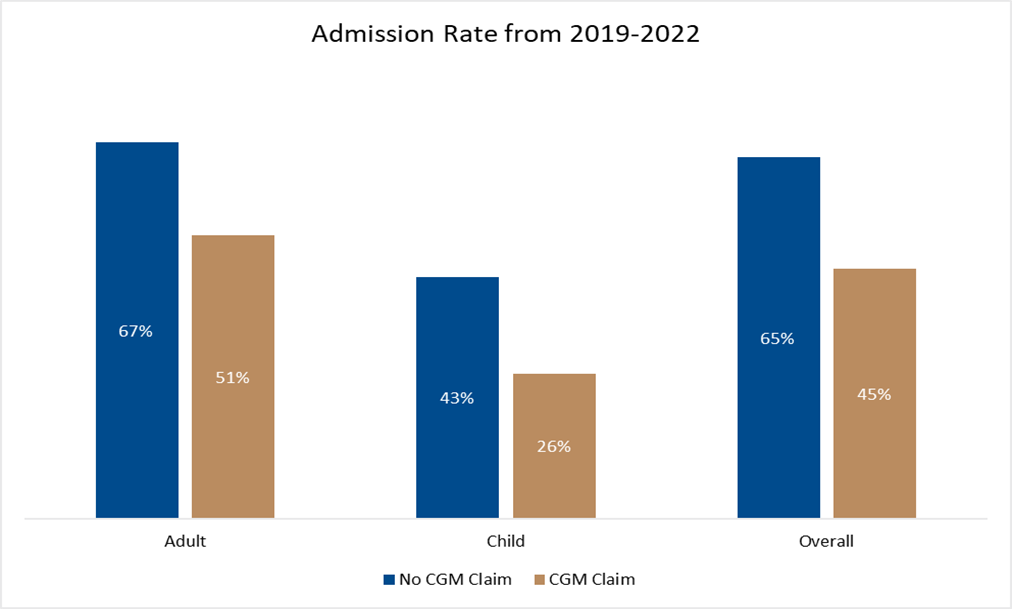
Figure 10: Admission rates for CGM claimants vs non-CGM claimants from 2019-2022 split by overall, adult and child populations - before adjusting for disease burden among members.
Figure 11 shows admission rates among CGM claimants and non-claimants, across the overall, child and adult DMS member populations.
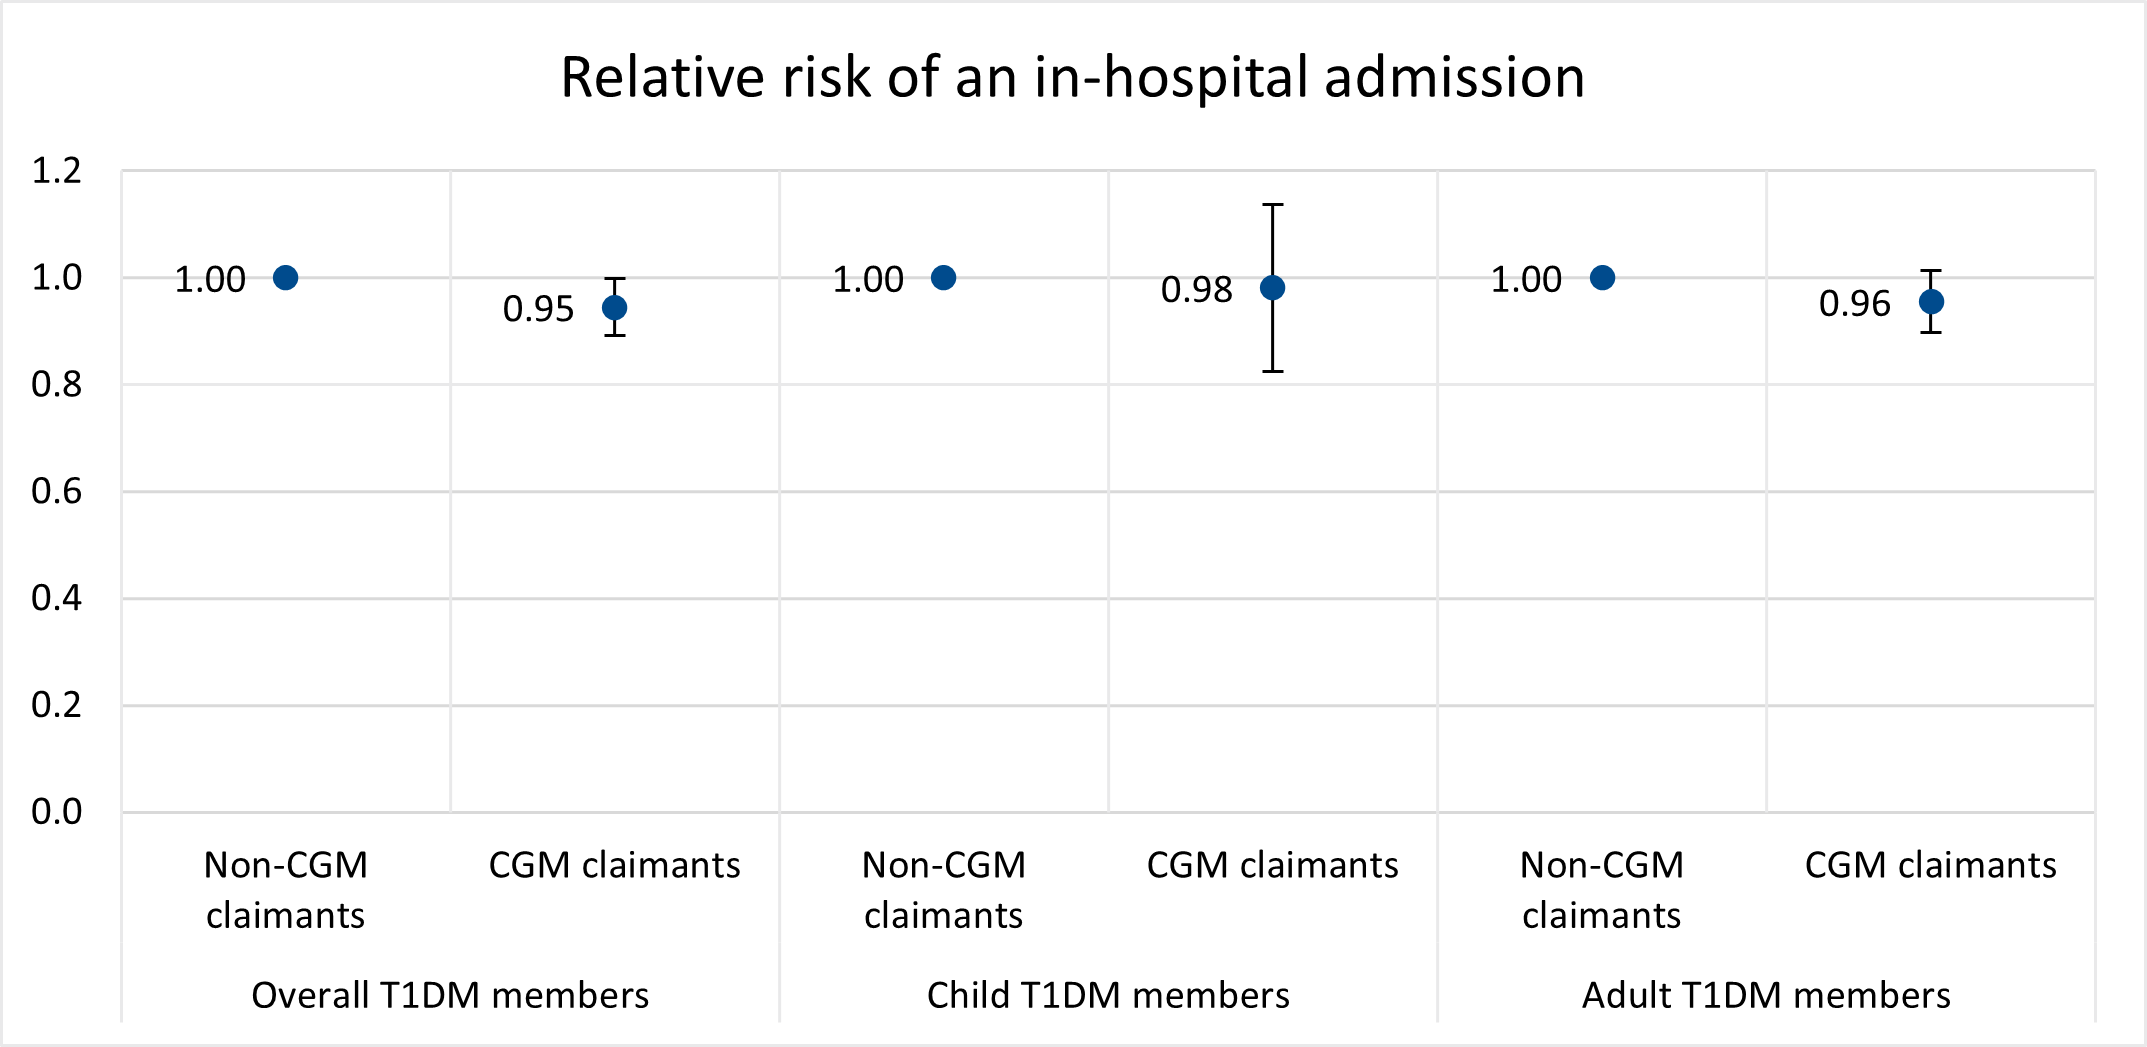
Figure 11: Relative risk of an in-hospital admission for CGM vs non-CGM claimants from 2019-2022 split between the overall, child and adult population groups.
The preventable quality indicator (PQI) admission rate was 3.4% for CGM-claimants and 5.9% for non-claimants (Figure 12). After adjusting for DBI (Figure 13) we saw an even more marked difference - a 13.52% lower PQI admission rate CGM claimants versus non-claimants.
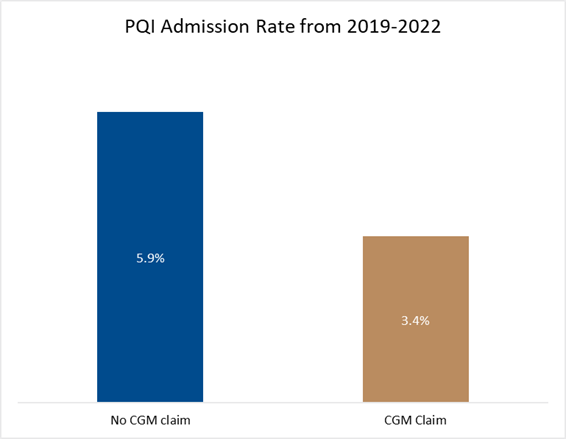
Figure 12: PQI admission rate for CGM claimants vs non-CGM claimants from 2019-2022
Figure 13 below compares the PQI admission rate, after adjusting for confounders, for those who are claiming for a CGM device relative to those who are not claiming for a CGM device across the overall T1DM population.
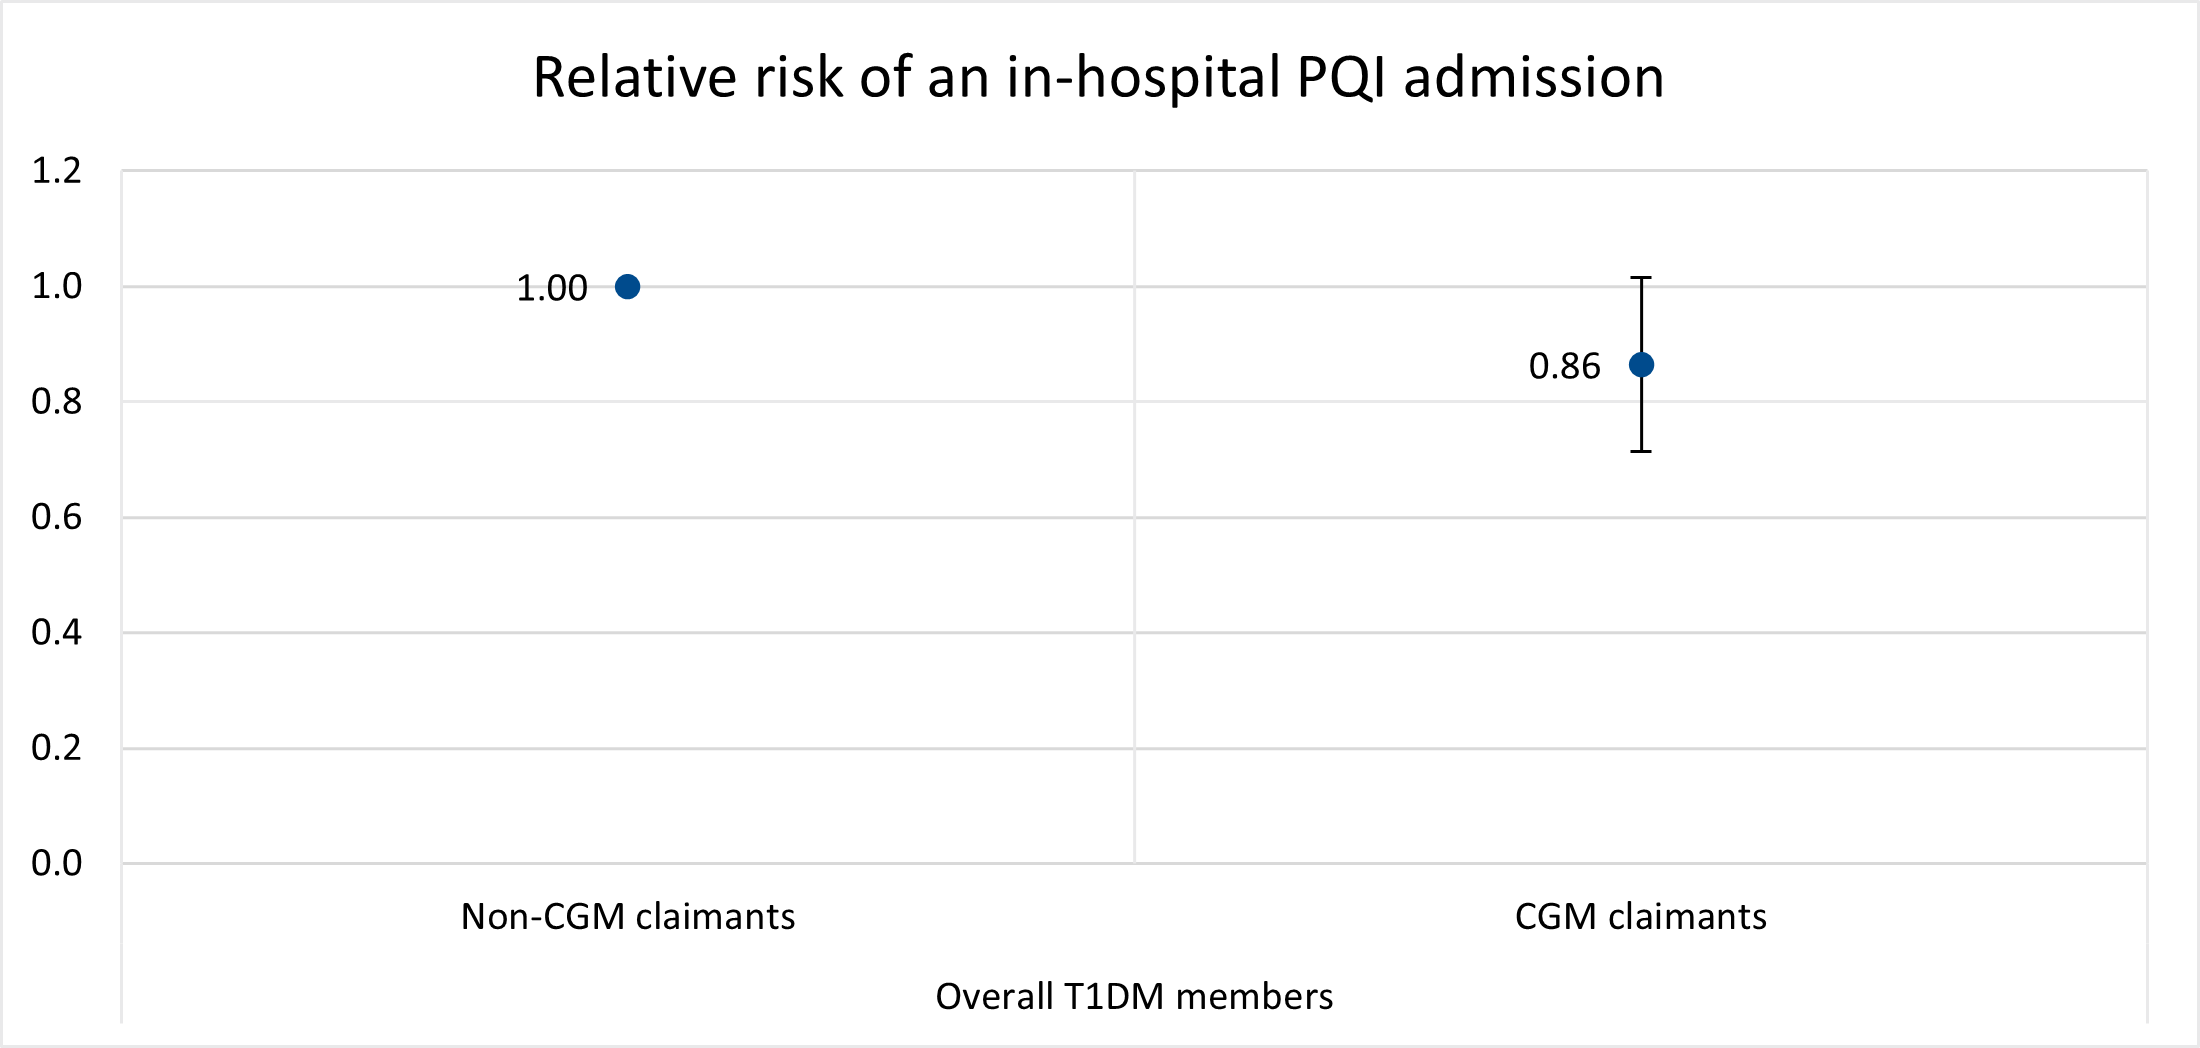
Figure 13: Relative risk of an in-hospital PQI admission for CGM vs non-CGM claimants from 2019-2022 split across the T1DM population.
Conclusion: For people who have T1DM, CGM use is beneficial for many reasons
CGM devices provide users with real time (on-demand or continuous) and trend data on blood sugar levels. This powerful insight allows for immediate adjustments to food, drink and medicine intake to help to keep blood sugar levels in-range. Use of a CGM gives a Scheme member or their caregiver far more information to work from in managing T1DM, with clear insight into how different foods or drinks, and activities impact blood sugar levels. These devices also store historical data for ease of reference or to share with a healthcare provider.
A quick recap ofour top findings:
In 2022 there were 7,406 DHMS members living with T1DM and eligible for the CGM benefit. Among these 36% of members claimed for CGM devices (which we assume to mean that they used CGM devices). We see a statistically significant improvement in glucose control (which we measure by looking at in-range HbA1c results) in members claiming for a CGM device versus non-claimants.
-
- More CGM claimants (12% higher proportion) achieved glucose control than non-claimants.
- And, after adjusting for DBI, we saw that CGM-claimants had a 5.41% lower hospital admission rate and a 13.52% lower PQI admission rate
Among adult members there was an average reduction of 0.1% in HbA1c results for non-CGM adult claimants over time, but a better reduction of 0.5% (so coming closer to in-range levels) after Scheme members began to claim for a CGM device. This implies that the information CGM devices give on blood sugar levels is beneficial in helping users to achieve in long-term blood glucose control.
Our results align with other studies - such as by Isaacson B, Kaufusi S, Sorensen J, et al., 2022 - showing the favourable clinical impact of continuous glucose monitoring on HbA1c levels, on patient outcomes and enhanced patient quality of life. While lower admission rates linked to CGM use provided cost savings for the Scheme, these savings were insufficient to cover the cost of CGM devices amongst all members with T1DM in 2022.
Isaacson B, Kaufusi S, Sorensen J, et al. Demonstrating the Clinical Impact of Continuous Glucose Monitoring Within an Integrated Healthcare Delivery System. J Diabetes Sci Technol. 2022;16(2):383-389. doi:10.1177/1932296820955228
Interested in knowing more or reporting on these findings?
Please contact us on MEDIA_RELATIONS_TEAM@discovery.co.za to request any updated data available since publication and to obtain any further context required.
Did you find this post interesting?
Please visit our Discovery Health Insights Hub for a range of analyses and insights shared by our Discovery Health Intelligence Team over the past three and a half years and spanning a variety of health-related themes.
ALL INFORMATION SHARED ON THIS PAGE IS BASED ON PERSPECTIVES GAINED FROM ANALYSIS OF FIGURES AND TRENDS EMANATING FROM DISCOVERY HEALTH'S DATA POOL. THE ANALYSIS, WHICH IS CONDUCTED BY DISCOVERY HEALTH'S ACTUARIAL AND DATA SCIENTIST TEAM, AIMS TO ENCOURAGE INDUSTRY DIALOGUE. THIS CONTENT IS SHARED FOR EDUCATIONAL AND INFORMATIONAL PURPOSES ONLY. IT DOES NOT CONSTITUTE PEER-REVIEWED, PUBLISHED SCIENTIFIC RESEARCH, AND HENCE SHOULD NOT BE INTERPRETED AS SUCH OR USED AS A BASIS FOR ALTERING TREATMENT DECISIONS.