10-year review of unplanned readmission rates shows a shift likely due to improved process changes (2013 - 2022).

Unplanned readmission rates increased slightly over the years reaching a historic low in the second year of COVID-19, with 2022 rates not back to pre-pandemic levels.
Authors
Discovery Health's Sian-Ailin da Silva (Statistician), Lizelle Steenkamp (Senior Healthcare Statistician), Lebohang Radebe (Senior Data Scientist, Discovery Health), Irakli Rekhviashvili (Junior Data Scientist), Shirley Collie (Chief Research Actuary)
Unplanned readmission rates indicate quality of care:
Why reducing these rates matters
Unplanned readmissions refer to individuals who are admitted to a hospital for treatment within a certain period of time after their initial discharge. This is possibly an important indicator of the quality of care provided to patients in their first admission. Both the Australian Commission on Safety and Quality1, as well as the Agency for Healthcare Research and Quality (AHRQ)2 at the US Department of Health and Human Services, view this as a care quality indicator. Lower unplanned readmission rates typically suggest better overall healthcare and outcomes and more efficient use of healthcare resources. On the other hand, high unplanned readmission rates indicate potential gaps in care and areas for improvement. If patients are being readmitted shortly after discharge, it suggests that their initial treatment or follow-up care may have been inadequate3. Unplanned readmissions contribute significantly to healthcare costs as patients who are readmitted often require additional medical interventions, tests, and treatments, which leads to increased expenses for the patient and healthcare funders. This has an inflationary impact on premiums, thus consequently impacting affordability of medical schemes. Monitoring unplanned readmission rates helps healthcare systems identify patterns and trends within specific sub-populations. This information can be used to develop targeted interventions and programs to address the underlying causes of unplanned readmissions. Cognisant of a need to centralise this type of data, Discovery Health's Hospital Care Initiative was launched in 2016. The objective of this platform is to provide consistent reporting on large-scale public rankings of private hospitals performance4.
Unplanned readmission trends in the US
In 2010, the United States introduced the Affordable Care Act (ACA), a comprehensive health care reform law to address health insurance coverage, health care costs, and preventative care. This also included applying financial penalties for higher-than-expected unplanned readmission rates for specific conditions. Although unplanned readmission rates were decreasing before the adoption of the ACA, there was a sharp decline in unplanned readmission rates immediately after the law was passed, and rates have continued to decline over the years. For example, unplanned readmissions for myocardial infarction (heart attacks), heart failure, and pneumonia in people who were 65 years or older, declined from 21.5% to 17.8% between 2007 and 20155. And, all-cause unplanned readmission rates for people in the same age group declined from 15.3% to 13.1% over the years.
Unplanned Readmission Rates in South Africa Over Time and Comparison with the USA
We've seen in DHMS members who are 65 years or older, unplanned readmission rates for myocardial infarction, heart failure, and pneumonia increase from 16.4% to 17.2% between 2009 and 2015. On average, these unplanned readmission rates were similar to Medicare beneficiaries in the United States. DHMS members experienced a 0.3% lower unplanned readmission rate on average, relative to Medicare beneficiaries.
-
- Myocardial infarction refers to a heart attack.
DHMS has been measuring unplanned readmission rates for the same conditions. Using a consistent methodology across all members of the medical scheme that are over the age of 18. These rates are shared with hospitals and used in the aforementioned Discovery Health's Hospital Care Initiative4. This engagement initiative and data sharing platform with these hospital groups, has shown a decrease in unplanned readmission rates over time (Figure 1).
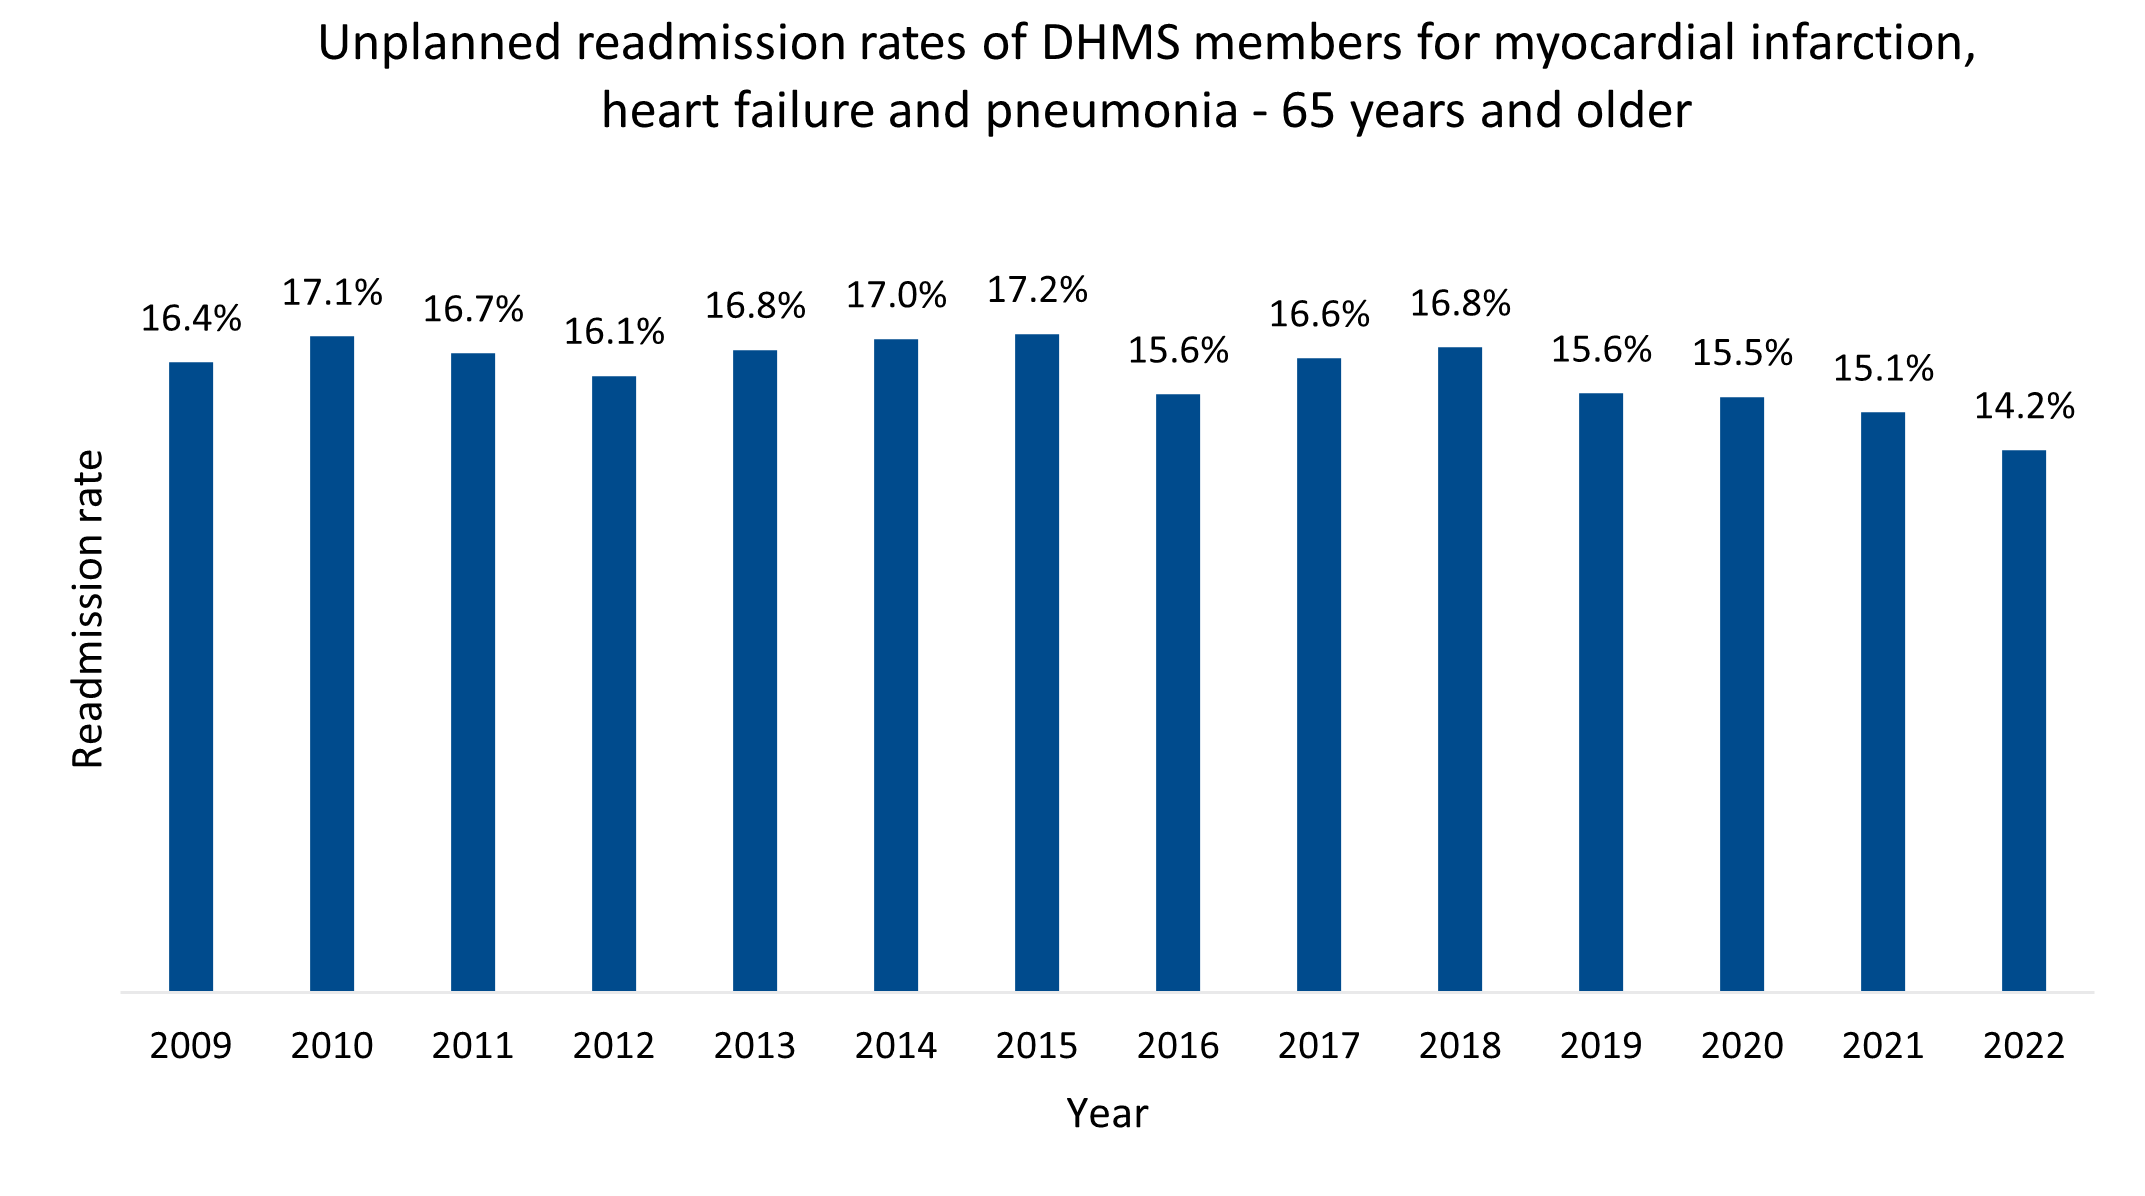
Figure 1 : Unplanned readmission rates for DHMS members - 65 years and older for myocardial infarction, heart failure and pneumonia.
Our investigation covered:
- Trends for 30-day all cause unplanned readmissions (to a private acute hospital) over a 10-year period across members of the DHMS and,
- The leading clinical causes of unplanned readmissions for our members.
-
- This investigation did not match the period indicated in the above graph, as we wanted to compare directly against statistics in the United States and, over a more consistent period
As a medical scheme, what do we classify as an unplanned readmission?
This refers to a situation where a patient is admitted to a private acute hospital for a second time within 30 days of their discharge date. Unplanned readmission rates were calculated as a percentage of all private acute hospital admissions in a given year.
We have applied these exclusions to the data:
- Members under the age of 18 years were excluded.
- Mental health admissions were excluded.
- Oncology related admissions were excluded.
- Delivery index admissions (caesarean sections or vaginal deliveries) were excluded.
- Planned readmissions6.were excluded to avoid counting readmissions that were intentionally planned during or prior to the index admission e.g., obstetric delivery, transplant surgery, maintenance chemotherapy etc.
- Index admissions where deaths occurred during the admission were excluded, as there would be no opportunity for a readmission.
-
- Index admissions refer to the initial hospitalisation or medical treatment that leads to a claim being submitted. They are used to monitor costs, outcomes and effectiveness of treatment and quality care.
Our findings
Between 2013 and 2019 (pre-pandemic years), the DHMS unplanned readmission rate increased slightly from 6.6% to 7.1%. During COVID-19 the unplanned readmission rate decreased to 6.3% in 2021, the lowest rate in the history of the scheme. The rate subsequently increased again in 2022 to 6.8%, however not back to pre-pandemic levels. This trend is consistent with overall DHMS hospital admissions7 in the same period. The absolute number of unplanned readmissions has grown from 28,007 in 2013 to 30,120 in 2022 (a 7.5% increase). Index admissions have grown from 425,836 to 444,397(a 4.4% increase), whilst DHMS membership has increased by 7.5% over the same period. However, the absolute number of unplanned readmissions did not revert to pre-COVID-19 numbers (13.1% lower in 2022 compared to 2019) (Figure 2).
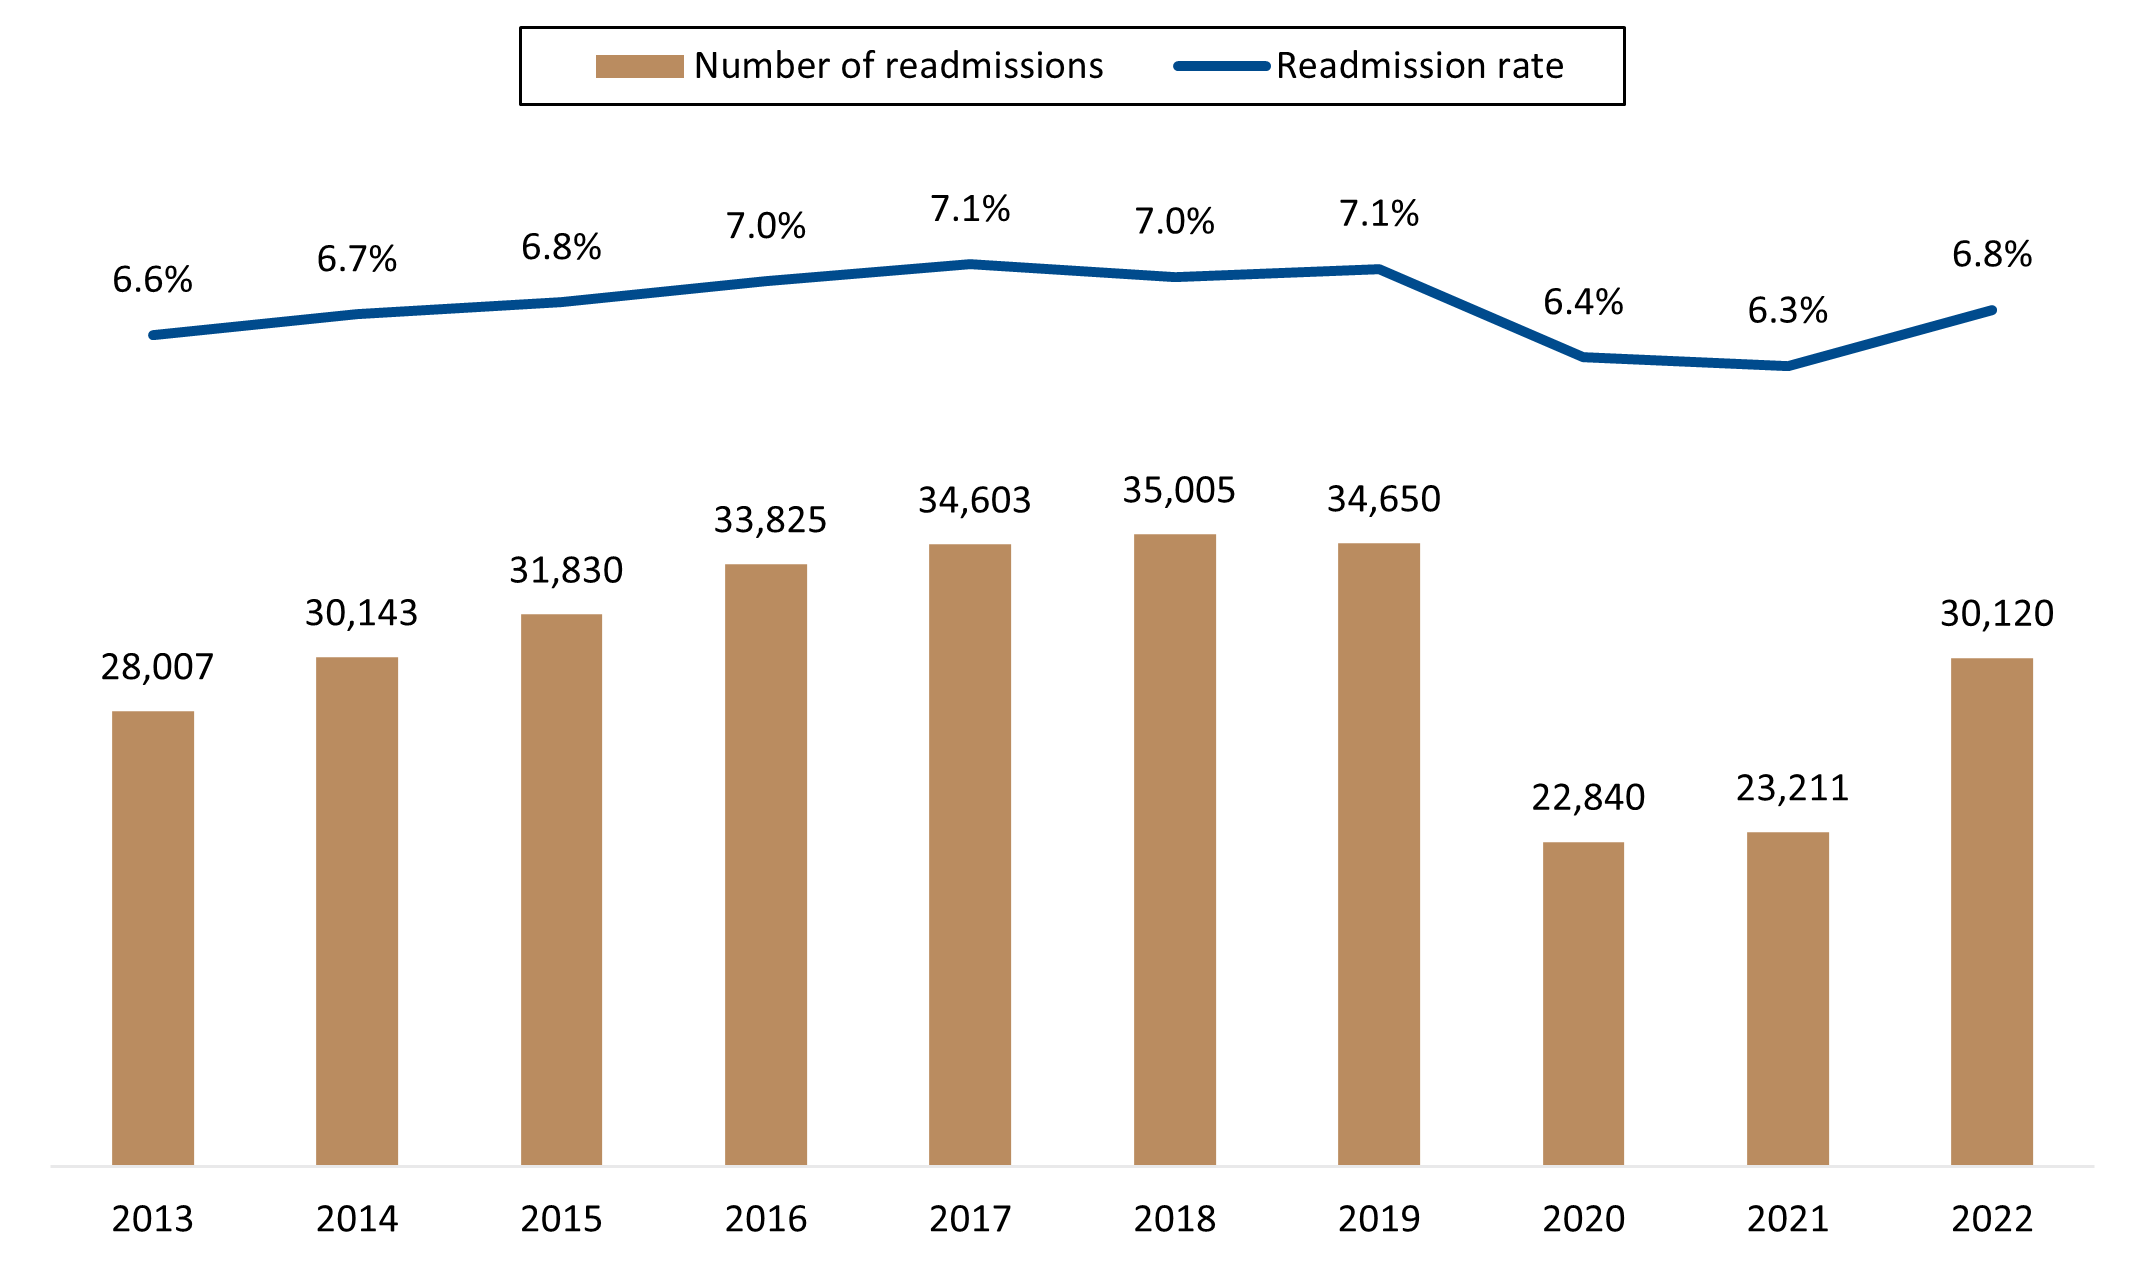
Figure 2 : 30-day all cause unplanned readmissions and readmission rate for DHMS members.
In 2013, 9.4% of unplanned readmissions occurred within one day of discharge from the index admission relative to 7.2% occurring within one day of discharge in 2022. Overall, 30% of unplanned readmissions in 2013 occurred within four days of discharge from the index admission, whereas 25% of unplanned readmissions occurred within four days of discharge in 2022 (Figure 3). This suggests that unplanned readmissions that occurred shortly after discharge, contributed to the reduction in the rate from 2013 to 2022.
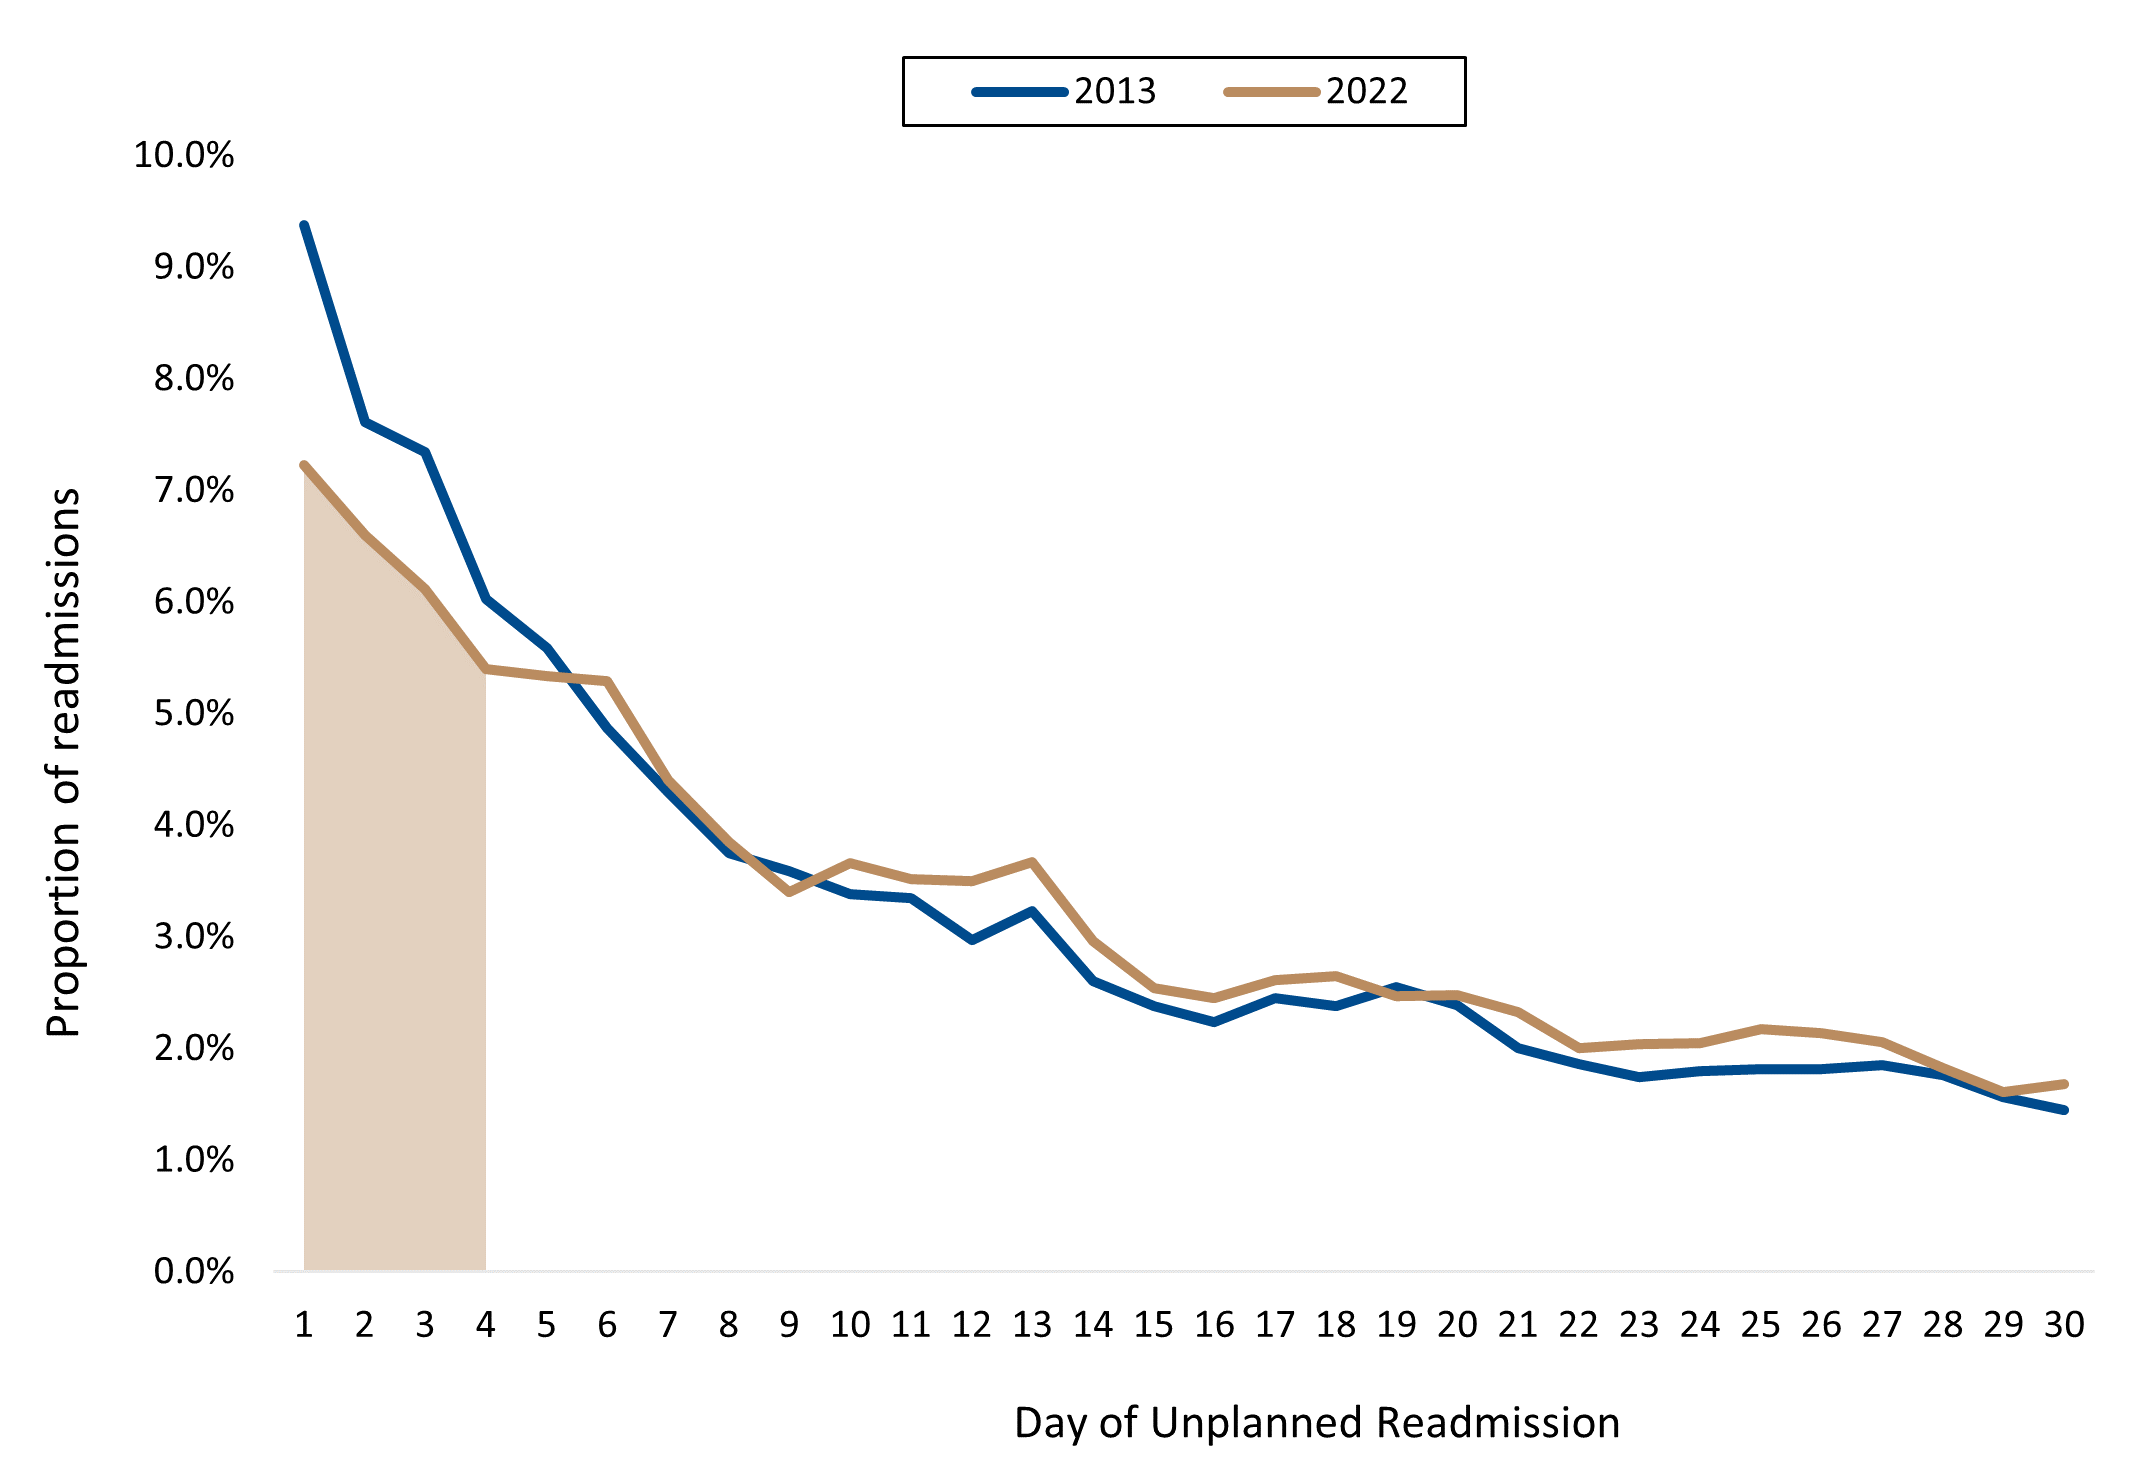
Figure 3 : Time to unplanned readmission in 2013 versus 2022.
What is contributing to a reduction in unplanned readmission rates since 2020?
Unplanned readmission risk may change over time. This is due to an underlying change in the clinical nature of the index admission and/or changes in treatment and discharge procedures within clinical care. The pandemic years saw a decrease in index admissions8 seen in a previous Health Insights report on 'How the pandemic affected rates of five common surgeries and diagnostic procedures.' With the decrease in index admissions, one would expect the volume of unplanned readmissions to decrease. However, the number of actual unplanned readmissions that occurred was even lower than the number of expected unplanned readmissions that were recorded during COVID-19. After accounting for the decrease in volume of admissions and the changes in the underlying type and severity of these admissions (Figure 4&5).
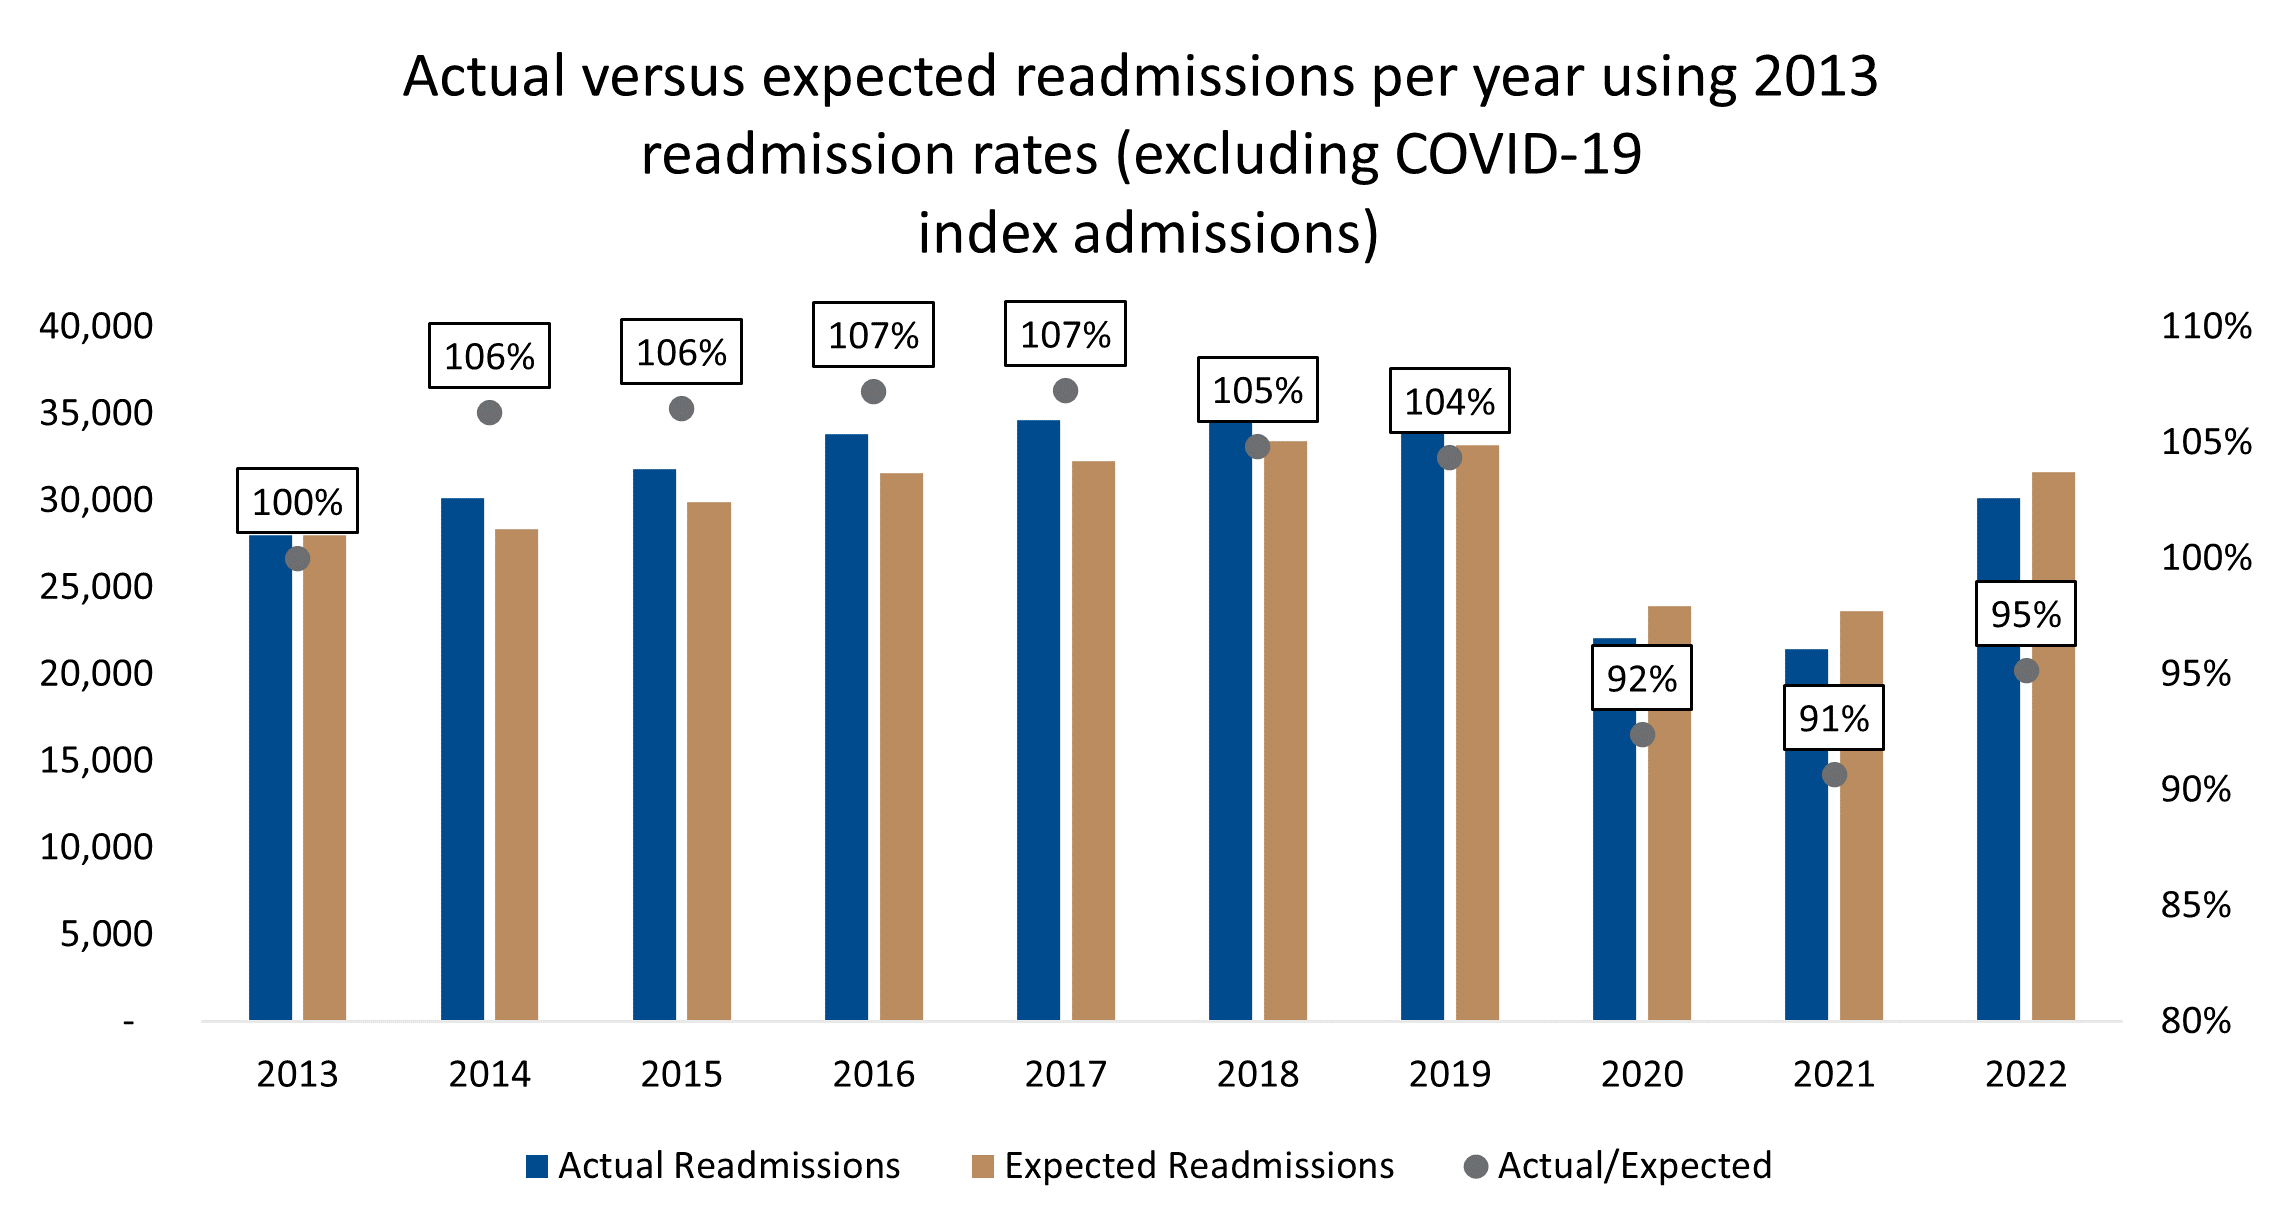
Figure 4 : Actual versus expected readmission rates per year based on the 2013 readmission rate observed
When comparing to the base of 2013, three of the five biggest contributors between actual versus expected, were similar to the base of 2019. These included acute pneumonia, breast procedures for malignancy and cataract and lens procedures. The other two relative to 2013 were major joint replacement and male reproductive procedures.
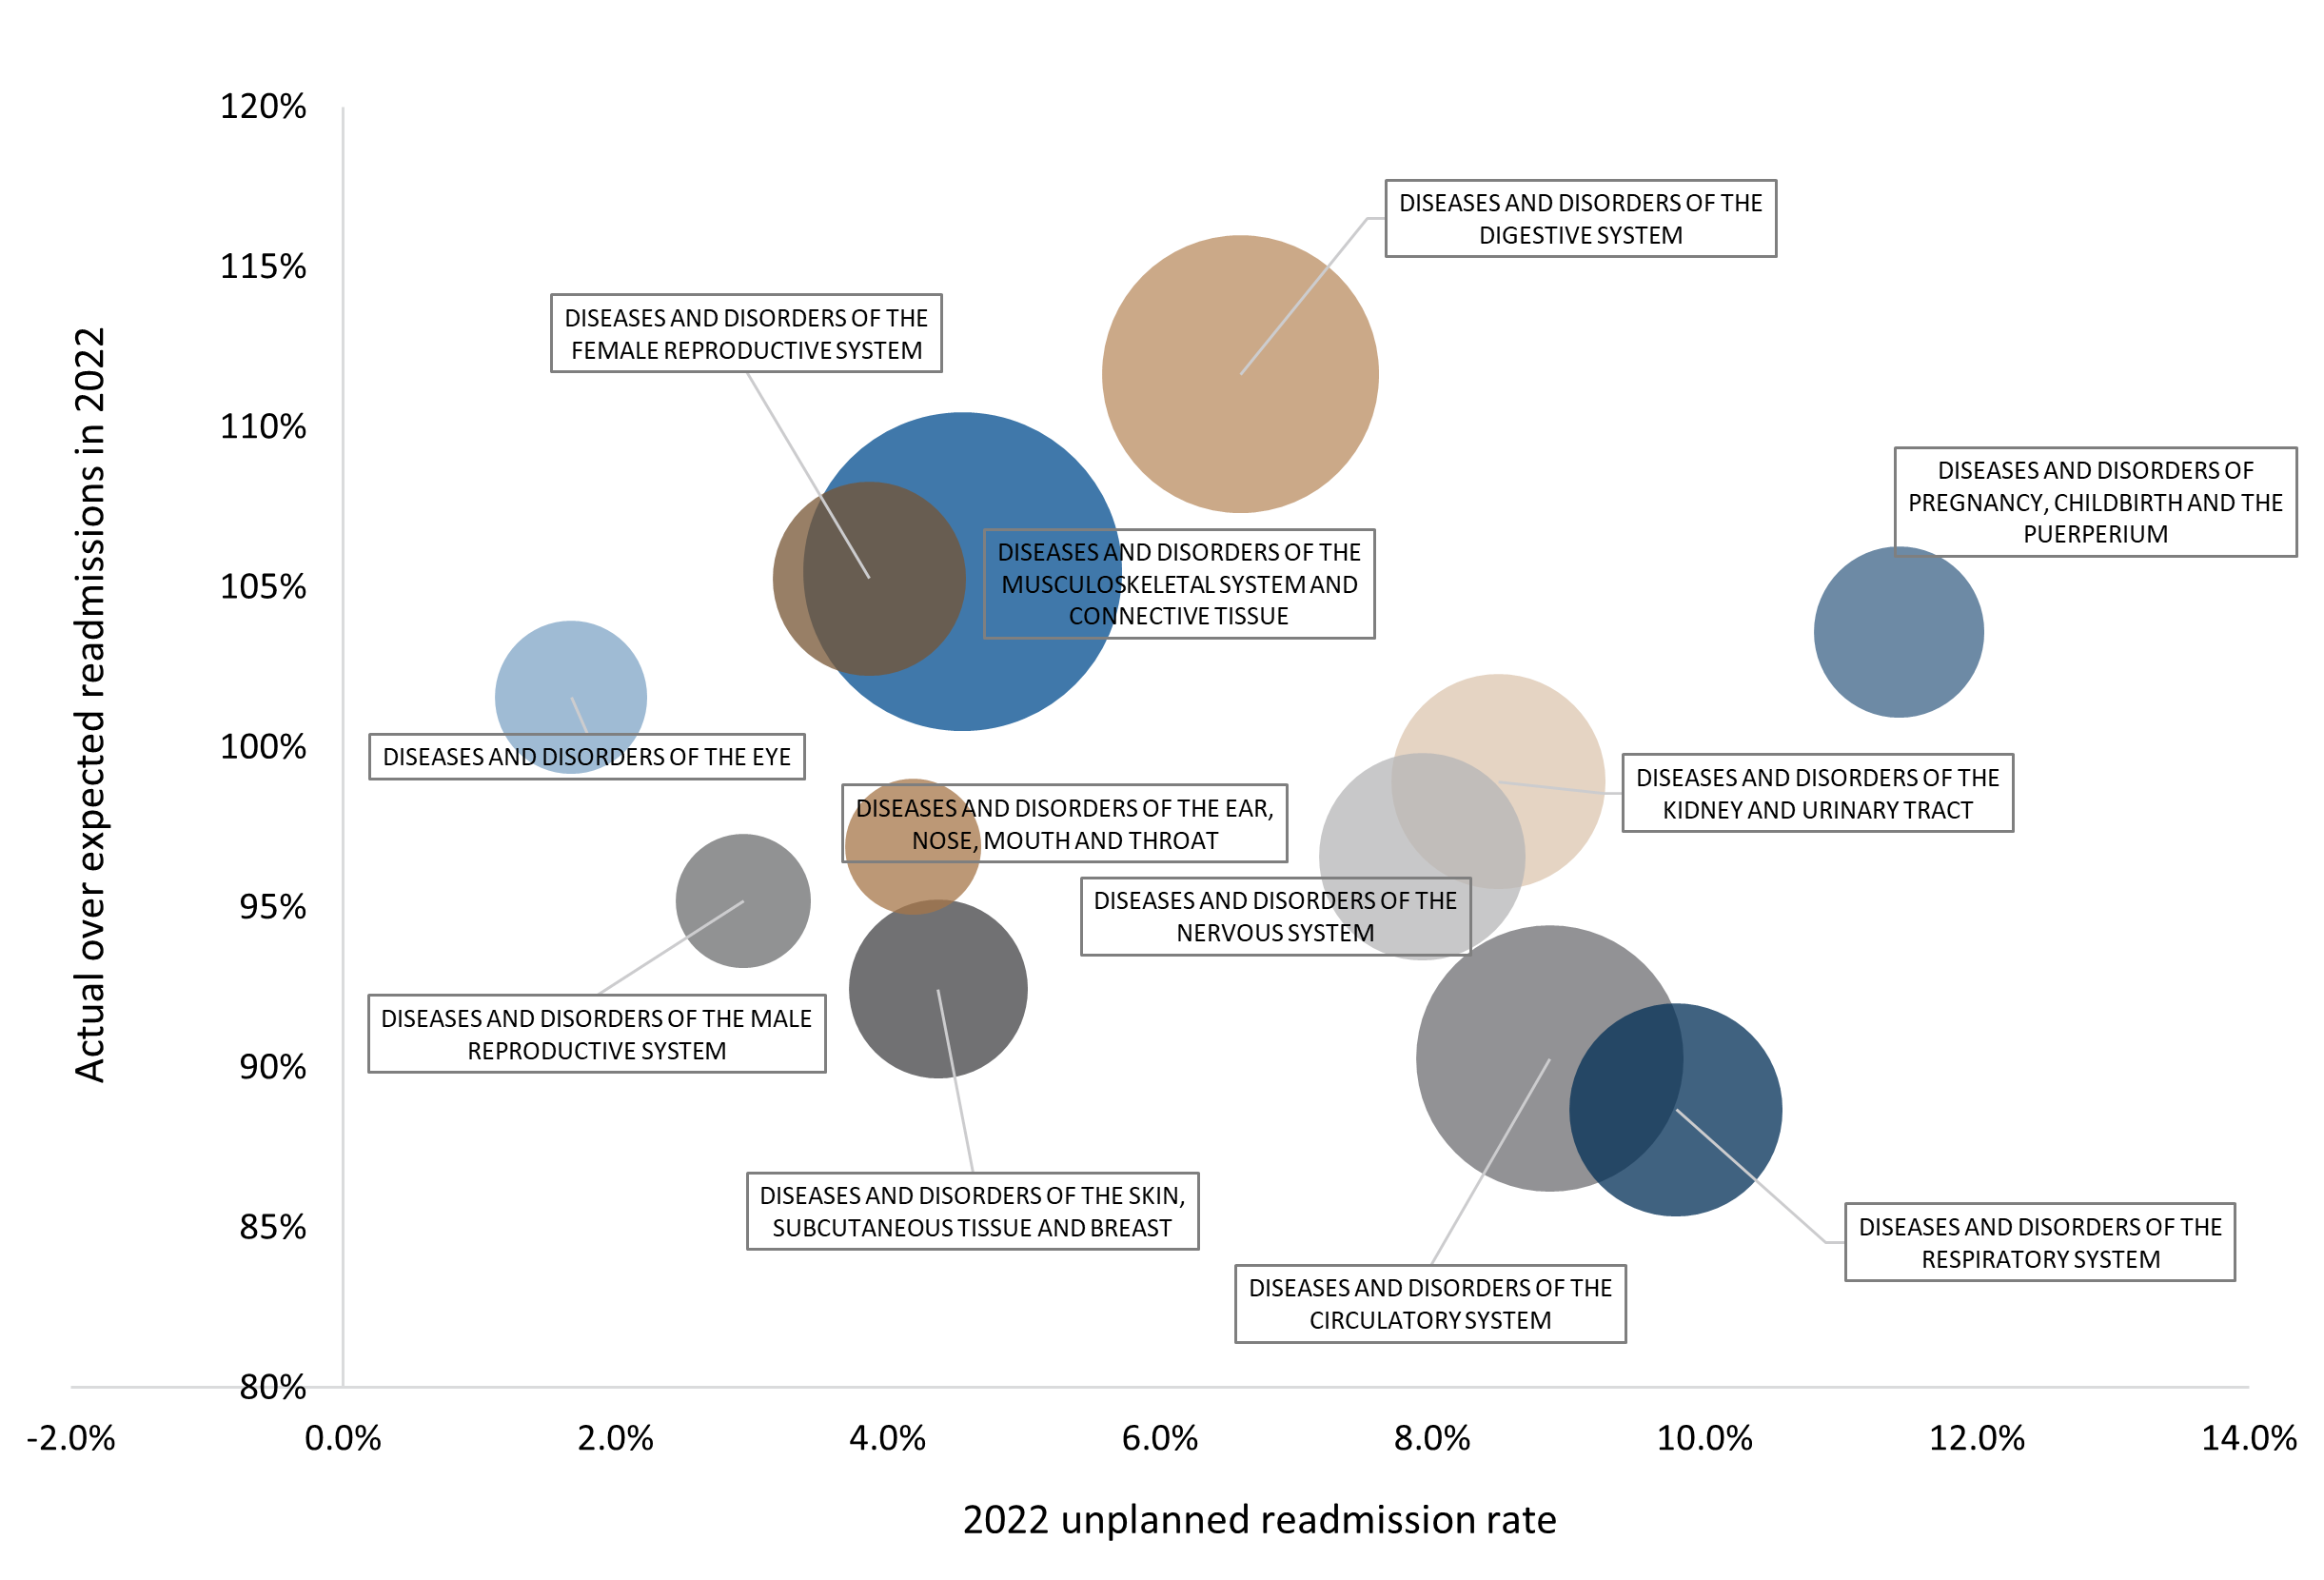
Figure 5 : 2022 Actual versus expected readmissions for the top 10 major diseases categories against 2022 readmission rate. Expected values calculated using 2013 readmission rate. Size of the bubbles represent total index admissions
Note: When actual versus expected readmissions (y-axis) are greater than 100% this implies the unplanned readmission rate has increased relative to the 2013 average. In figure 5 above, we see, most major disease categories are plotted below 100%. This indicates a decrease in unplanned readmission risk relative to 2013.
This implies that the unplanned readmission risk within clinical diagnosis groups has decreased since the start of the pandemic in 2020 and has remained depressed through to 2022. The unplanned readmission rate in 2022 was at 6.8%, whereas the expected readmission rate using 2019 as the base, was projected at 7.4%. This 0.6% differential from actual to expected readmission rates can be ascribed to a change in treatment and discharge procedures within clinical care over time.
Procedures & conditions - what did actual versus expected readmissions show?
Using 2019 as base, the biggest difference in actual versus expected readmissions were noted in lens and cataract procedures, breast procedures for malignancy, acute pneumonia, seizures and medical back problems. Readmissions following a cataract procedure, exclude planned readmissions for cataract procedures on a second eye or, the delayed insertion of a lens and represent probable complications arising from the primary procedure. These complications include retinal complications (detachment/breaks), vitrectomy, management of glaucoma and infection control.
-
- Vitrectomy is a term for surgery to remove some or all of the vitreous humour from the eye to provide better access to the retina.
- Glaucoma is a condition of increased pressure within the eyeball, causing gradual loss of sight.
In Conclusion
Unplanned readmissions are a significant contributor of cost both to the member and the healthcare system. An important indicator of the quality of care a patient receives. DHMS unplanned readmission rates increased slightly over the years, from 6.6% in 2013 to 7.1% in 2019. This rate dropped in the COVID-19 pandemic years and are currently not back up to pre-pandemic rates in 2022. In 2013, 30% of unplanned readmissions occurred within four days of discharge from the index admission. Whereas in 2022, 25% of unplanned readmissions occurred within four days.
When we investigated the cause of the reduction in unplanned readmission rates post COVID, we reviewed actual versus expected readmissions. Observing that the unplanned readmission risk within clinical diagnosis related groups decreased since the start of the COVID19 pandemic and remained depressed through 2022. A 0.6% difference between the actual versus expected readmission rate in 2022 when compared to the 2019 readmission rate across clinical diagnosis groups was observed. This indicates that improved process changes within clinical modalities, are likely to assist in preventing unplanned readmissions.
1. Australian Commission on Safety and Quality in Health Care 'Avoidable hospital readmissions'
https://www.safetyandquality.gov.au/our-work/indicators/avoidable-hospital-readmissions
2. Agency for Healthcare Research and Quality (AHRQ) at the US Department of Health and Human Services
https://www.ahrq.gov/topics/hospital-readmissions.html
3. Benbassat, J et al. (2000) Hospital Readmissions as a Measure of Quality of Health Care. Arch Intern Med. 2000;160(8):1074-1081. doi:
10.1001/archinte.160.8.1074
4. Champion, J et al. (2022) Discovery Health's Hospital Care Initiative is the first in South Africa to provide consistent public rankings of private hospital performance. Discovery Health Insights Hub.
https://www.discovery.co.za/corporate/health-insights-discovery-healths-hospital-care
5. N Engl J Med 2016;374:1543-1551 DOI: 10.1056/NEJMsa1513024 Readmissions, Observation, and the Hospital Readmissions Reduction Program
https://www.nejm.org/doi/full/10.1056/nejmsa1513024#:~:text=Rate%20of%20Change%20over%20Time,13.1%25%20(Table%201)
6. Horwitz et al. (2013) Centers for Medicare > Medicaid Services Planned Readmission Algorithm -- Version 2.1.
Yale New Haven Health Services Corporation Center for Outcomes Research > Evaluation.
Readmission-Planned-CMS-Readmission-Algorithm-Report-03-14-2013.pdf
7. Nematswerani, Steenkamp et al. (2023) SAMJ Publication: Analysis confirms COVID-19 disrupted private healthcare in South Africa
https://www.discovery.co.za/corporate/health-insights-disruption-of-private-healthcare
8. Collie, S et al. (2022) How the pandemic affected rates of five common surgeries and diagnostic procedures
https://www.discovery.co.za/corporate/health-insight-how-pandemic-has-affected-surgeries)
IInterested in knowing more or reporting on these findings?
Please contact us on MEDIA_RELATIONS_TEAM@discovery.co.za to request any updated data available since publication and to obtain any further context required.
Did you find this post interesting?
Please visit our Discovery Health Insights Hub for a range of analyses and insights shared by our Discovery Health Intelligence Team over the past three and a half years and spanning a variety of health-related themes.
All information shared on this page is based on perspectives gained from analysing data acquired by Discovery Ltd and its various affiliate entities (Discovery). The analysis, which is conducted by Discovery's actuarial and data science team, aims to encourage industry dialogue. Publications containing our analyses are shared for educational and informational purposes only. Each publication reflects only the data available for analysis at the time of publication. It does not, unless otherwise indicated, constitute peer-reviewed, published scientific research, and hence should not be interpreted as such or used as a basis for altering treatment decisions. While every effort has been made to ensure the accuracy of the content conveyed, we cannot be held liable or responsible for any actions or decisions taken based on the information shared in this article.

13 min read
Long COVID symptoms, impact on carrying out daily activities: Survey of just over 7,000 medical scheme members reveals key insights
16 June 2022
Authors: Shirley Collie (Chief Healthcare Analytics Actuary, Discovery Health), Lizelle Steenkamp (Senior Healthcare Statistician, Discovery Health), Lebohang Radebe (Data Scientist, Discovery Health), Dr Smybinn Mathews (Clinician, Discovery Health) and Dr Dave Jacobs (Senior Clinician and Clinical Classification System Architect, Discovery Health)